
Figure 2.
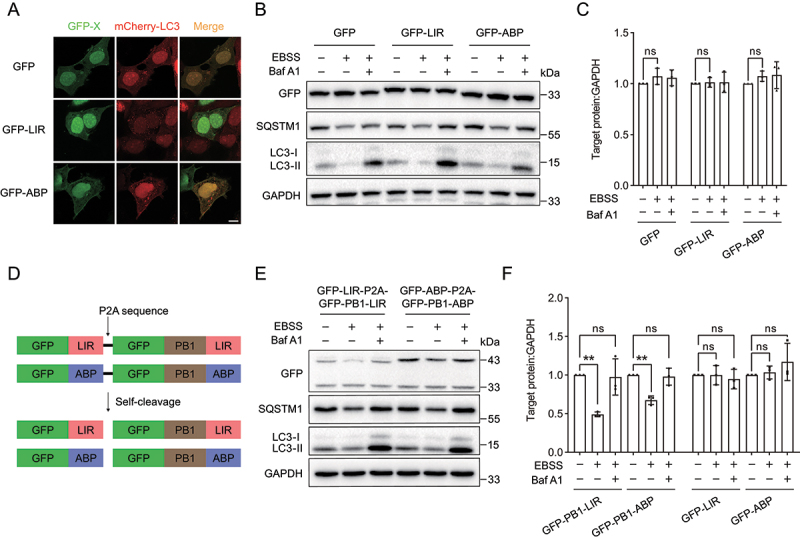
The autophagy-targeting degradation strategy shows high selectivity for large protein aggregates. (A) Representative images of mCherry-LC3 with GFP, GFP-LIR or GFP-ABP in HEK293 cells. mCherry-LC3 was transiently cotransfected with GFP, GFP-LIR or GFP-ABP in HEK293 cells. (B) Immunoblot analysis of GFP, GFP-LIR and GFP-ABP under starvation condition. GFP, GFP-LIR and GFP-ABP were transiently transfected into HeLa cells for 24 h, followed by incubation in EBSS for 12 h. The autophagy inhibition group was treated with EBSS containing 1 µM Baf A1. (C) Quantification of the levels of target proteins as in (B). (D) Scheme of GFP-LIR-P2A-GFP-PB1-LIR and GFP-ABP-P2A-GFP-PB1-ABP constructs. The self-cleavage sequence P2A enables the same amounts of soluble and PB1-generated protein aggregates. (E) Immunoblot analysis of GFP-LIR-P2A-GFP-PB1-LIR and GFP-ABP-P2A-GFP-PB1-ABP under starvation condition. The constructs were transiently transfected into HeLa cells for 24 h, followed by incubation in EBSS for 12 h. The autophagy inhibition group was treated with EBSS containing 1 µM Baf A1. (F) Quantification of the levels of target proteins as in (E). Data in (C) and (F) are presented as the mean ± SEM of three independent experiments. “ns”, no significant difference; **p < 0.01, ***p < 0.001, Student’s t test. Scale bar: 10 μm.