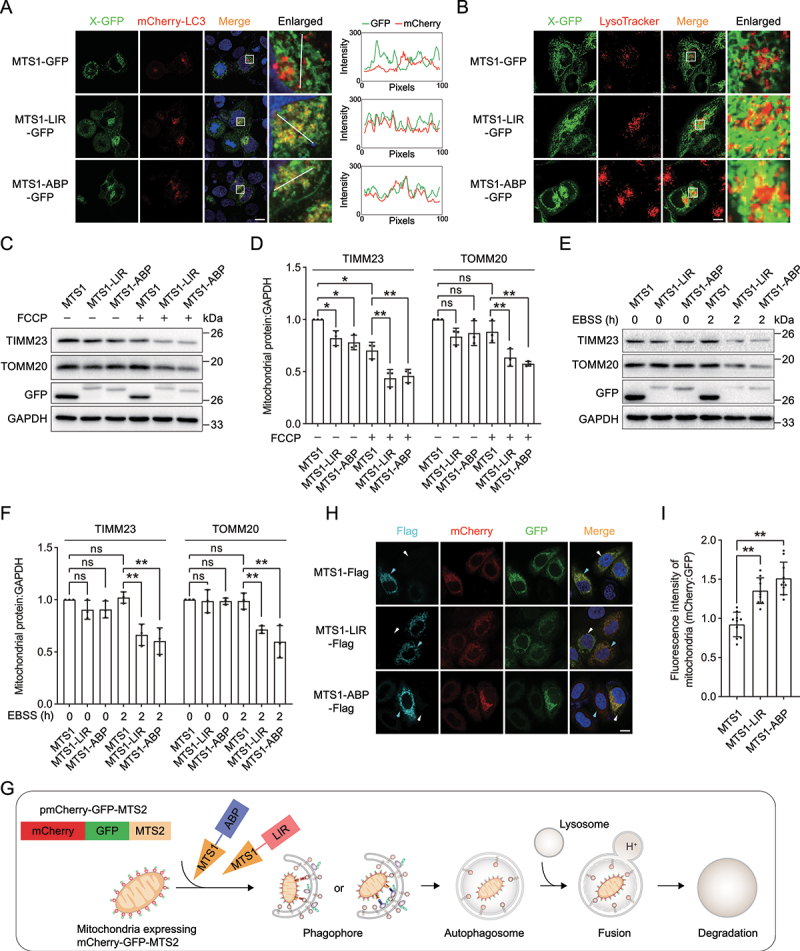
Figure 6.

Tethering ATG16L1 or LC3 induces targeted degradation of mitochondria. (A) Representative images of MTS1-LIR-GFP and MTS1-ABP-GFP with mCherry-LC3 in HeLa cells. HeLa cells stably expressing mCherry-LC3 were transiently transfected with MTS1-GFP, MTS1-LIR-GFP or MTS1-ABP-GFP. The colocalization of mCherry-LC3 with MTS1-LIR-GFP or MTS1-ABP-GFP was determined by calculating fluorescence intensity of the areas marked with white lines. (B) Representative images of MTS1-LIR-GFP and MTS1-ABP-GFP with lysosomes in HeLa cells. MTS1-GFP, MTS1-LIR-GFP and MTS1-ABP-GFP were transiently transfected into HeLa cells, followed by lysosome staining with LysoTracker. (C) Immunoblot analysis of the mitochondrial proteins TIMM23 and TOMM20 upon the expression of MTS1-LIR and MTS1-ABP in HeLa cells in response to FCCP-induced mitochondrial dysfunction. MTS1-LIR and MTS1-ABP were transiently transfected into HeLa cells for 36 h, followed by treatment with 20 µM FCCP for 12 h. (D) Quantification of the levels of the mitochondrial proteins TIMM23 and TOMM20 as in (C). (E) Immunoblot analysis of the mitochondrial proteins TIMM23 and TOMM20 upon the expression of MTS1-LIR and MTS1-ABP in HeLa cells in response to starvation condition. (F) Quantification of the levels of the mitochondrial proteins TIMM23 and TOMM20 as in (E). (G) Scheme of mitophagy biosensor mCherry-GFP-MTS2. (H) Representative images of mCherry-GFP-MTS2 upon MTS1-LIR- and MTS1-ABP-induced mitophagy. Cells expressing mCherry-GFP-MTS2 were transiently transfected with MTS1-Flag, MTS1-LIR-Flag or MTS1-ABP-Flag for 24 h, followed by treatment with 20 µM FCCP for 6 h. The cyan arrows indicate cells that express MTS1, MTS1-LIR or MTS1-ABP, whereas the white arrows indicate cells that have no expression of these constructs. (I) Quantification of the relative fluorescence intensity as in (H) (n = 50). The fluorescence intensity of cells with the expression of MTS, MTS1-LIR or MTS1-ABP (indicated by the cyan arrows in (H)) was measured by ImageJ. Data in (d) and (F) are presented as the mean ± SEM of three independent experiments. *p < 0.05, **p < 0.01, Student’s t test. Scale bar: 10 μm.
