
Fig. 2.
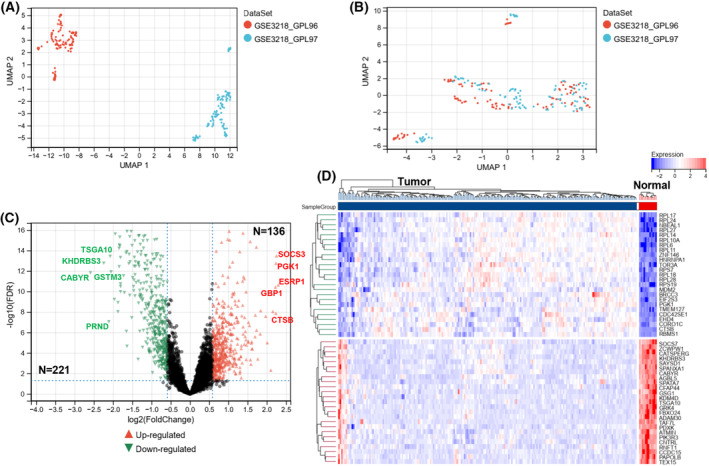
Identification of DEGs. Uniform manifold approximation and projection (UMAP) between datasets before de‐batching (A) and after de‐batching (B). (C) The volcano plot was constructed based on fold change values and P‐adjust, with red and blue dots representing upregulated and downregulated genes, respectively. (D) The heatmap depicting the top 50 genes identified through analysis of differential gene expression.