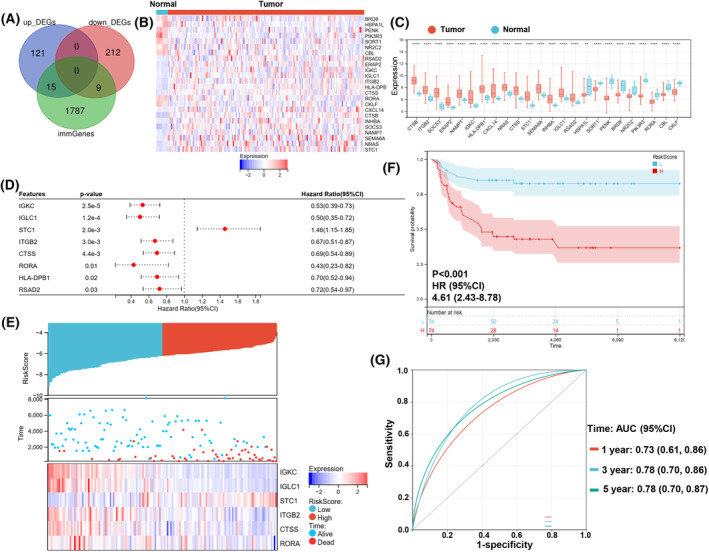
Fig. 3.

Differentially expressed immune genes and construction of the immune‐related genes risk signature. (A) Immune gene vs. DEG Venn diagram. (B) The heatmap of 24 immDEGs. (C) The expression histogram of 24 immDEGs in TGCT (n = 202) and normal tissues (n = 12). (D) Identification of eight immDEGs associated with OS of TGCT via univariate Cox regression. (E) The risk score, survival time, and survival status of TGCT. (F) Kaplan–Meier survival analysis of the two risk groups, TGCT samples were divided into high‐ and low‐risk groups based on their median risk score. (G) Time‐dependent ROC curves verified the predictive efficacy of the risk signature at 1, 3, and 5 years. Presentation of data as means ± standard deviation. **P < 0.01; ****P < 0.0001; rank‐sum test. immGenes, immune genes.
