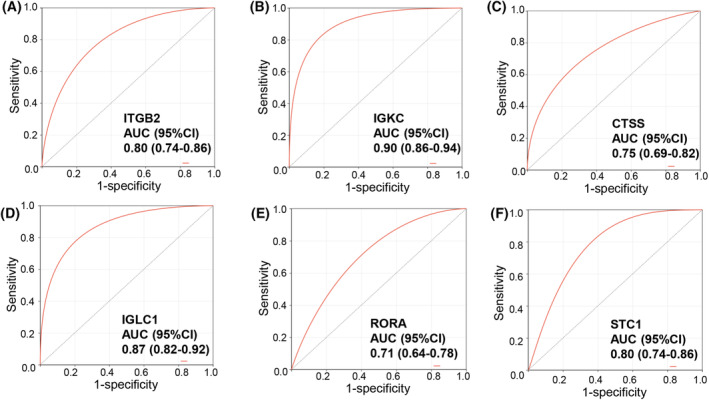
Fig. 6.

ROC curves of six characterized genes demonstrating their ability to distinguish between Cluster 1 and Cluster 2 independently. ROC curves of ITGB2 (A), IGKC (B), CTSS (C), IGLC1 (D), RORA (E), and STC1 (F).

ROC curves of six characterized genes demonstrating their ability to distinguish between Cluster 1 and Cluster 2 independently. ROC curves of ITGB2 (A), IGKC (B), CTSS (C), IGLC1 (D), RORA (E), and STC1 (F).