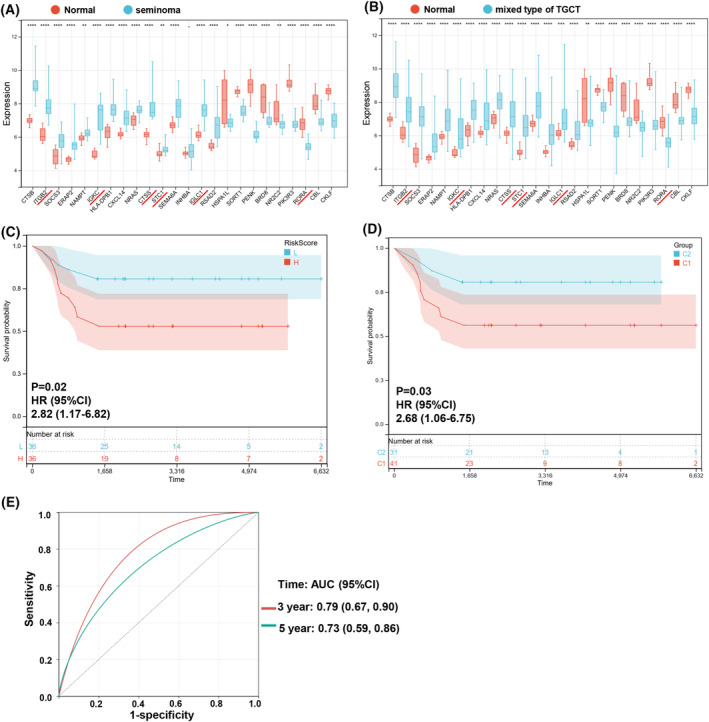
Fig. 10.

(A) Expression histogram of 24 immDEGs in seminoma (n = 26) and normal tissues (n = 12). (B) The expression histogram of 24 immDEGs in mixed type of TGCT (n = 90) and normal tissues (n = 12). (C) Kaplan–Meier survival analysis of the two risk groups, mixed type of TGCT samples were divided into high‐ and low‐risk groups based on their median risk score. (D) Kaplan–Meier survival analysis of the two immune molecular subtypes in mixed type of TGCT samples. (E) Time‐dependent ROC curves verified the predictive efficacy of the risk signature at 3 and 5 years in mixed type of TGCT samples. *P < 0.05; **P < 0.01; ****P < 0.0001; rank‐sum test.
