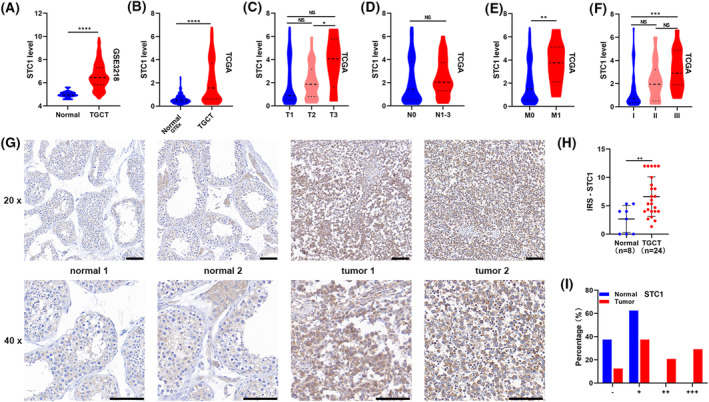
Fig. 12.

Elevated expression levels of STC1 positively correlated with advanced clinicopathological features and indicated poor prognosis. (A, B) The expression levels of STC1 increased in TGCT in GSE3218 and TCGA. (C–F) STC1 expression levels in TGCT tissues with different tumor stages, lymph node metastasis status, metastasis status, and grade status. (G) STC1 expressions in 32 clinical samples were detected by IHC. Scale bars: 100 μm. (H) Quantification of STC1 protein expression in TGCT tissues and normal tissues. (I) The proportion of clinical tissues with negative (−), weak (+), moderate (++), and strong (+++) STC1 staining intensity. Presentation of data as means ± standard deviation. NS P > 0.05; *P < 0.05; **P < 0.01; ***P < 0.001; ****P < 0.0001; rank‐sum test. T, tumor stage; N, lymph node metastasis; M, metastasis.
