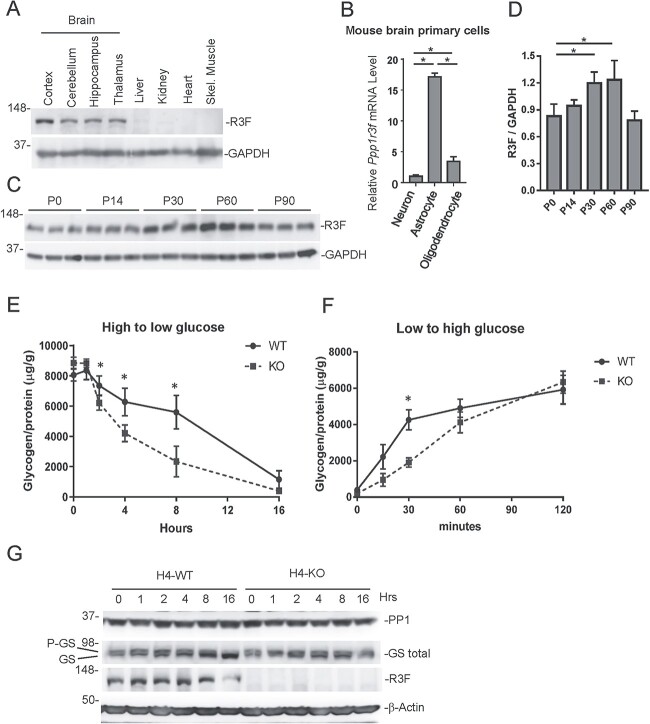
Figure 2.
R3F expression pattern and its role in regulating glycogen levels. (A) Immunoblotting detection of R3F in various mouse tissue lysates with GAPDH as a loading control. (B) Comparison of Ppp1r3f mRNA levels in mouse astrocytes and oligodendrocytes relative to neurons. The expression level in the neuron is set as 1. (C) Immunoblotting detection of R3F in brain lysates prepared from mice of indicated ages. Three mice were analyzed for each time point. (D) Quantification of relative R3F and GAPDH band intensities in D. *P < 0.05. (E) Relative glycogen levels (glycogen/protein) in WT and PPP1R3F KO cells at indicated hours after switching from high glucose medium to low glucose medium. *P < 0.05. (F) Relative glycogen levels (glycogen/protein) in WT and R3F KO cells at indicated minutes after switching from low glucose medium to high glucose medium. *P < 0.05. (G). Immunoblotting analysis of PP1, GS, R3F and β-actin levels in WT and KO H4 cells collected at indicated hours after switching from high glucose medium to low glucose medium.

