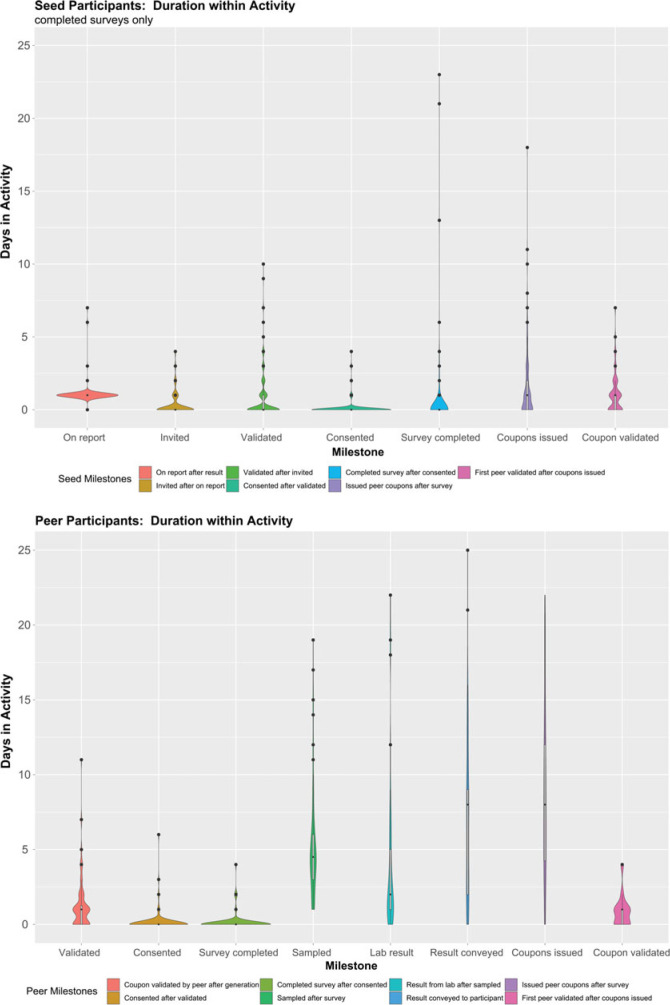
FIGURE 1.
Study Milestones Are Shown as Categories on the x-Axis, and the y-Axis Is Time in Days From the Prior Milestone to the Milestone Describeda
aIn these violin plots, the width is indicative of the density of the data at each y-axis value (days to complete the milestone) and the dots at higher y-values are outliers based on the interquartile range. For both seed and peer cases, we see that each of the first steps in the enrollment process was typically completed in not more than 1 day. In fact, 67% of seed cases progressed through completing the survey in 3 or fewer days after diagnosis.

