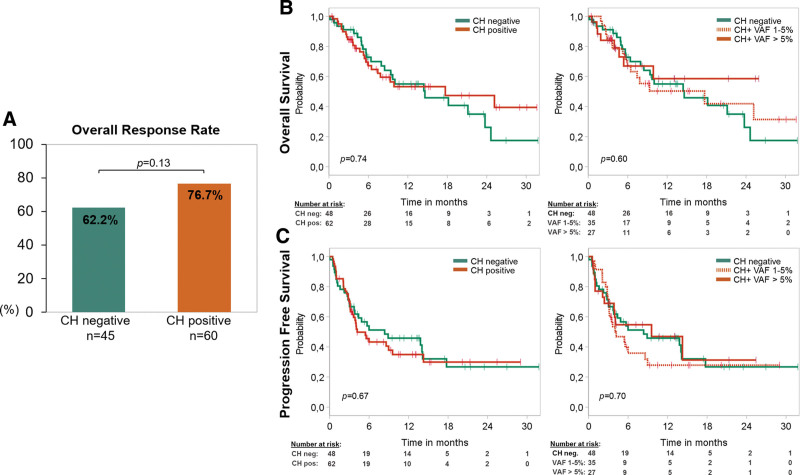
Figure 4.
CH and survival after treatment with CAR T- therapy. (A) Diagram demonstrating the best ORR during the first 180 days after CAR T-cell treatment stratified by absence (green, n = 45) or presence (orange, n = 60) of CH with a VAF cutoff 1%, respectively. P-value was calculated with Fisher exact test. Patients with lack of follow-up data or death before progress/response were excluded (n = 5). (B) Kaplan-Meier curves showing overall survival of 110 patients undergoing CAR T-cell therapy stratified by absence (green, n = 48) or presence (orange, n = 62) of CH with a VAF cutoff 1% and stratified by the size of the clone considering low VAF 1%–5% (orange dashed) and high VAF >5% (orange). (C) Kaplan-Meier curves showing progression-free survival of 110 patients undergoing CAR T-cell therapy stratified by absence (green, n = 48) or presence (orange, n = 62) of CH with a VAF cutoff 1% and stratified by the size of the clone considering low VAF 1%–5% (orange dashed) and high VAF >5% (orange). P-value was calculated for (B) and (C) with log-rank test. CAR = chimeric antigen receptor; CH = clonal hematopoiesis; ORR = overall response rate; VAF = variant allele frequency.

