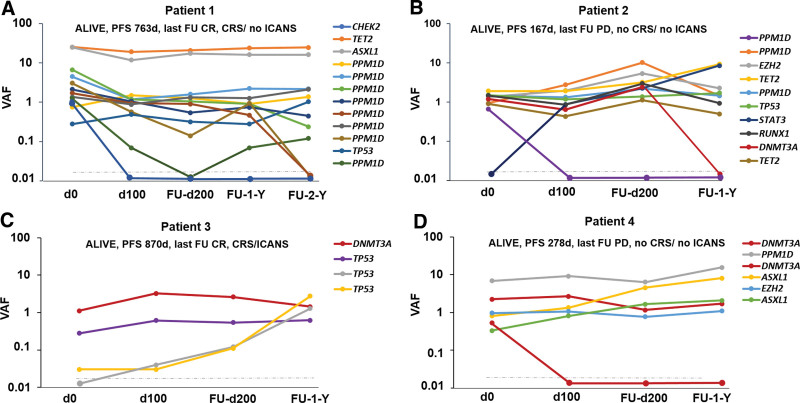
Figure 5.
Clonal dynamics after CAR T-cell therapy. (A–D) VAFs at the time of CAR T-cell treatment and individual time points of sampling and corresponding mutational and clinical data. The gray dashed line depicts our VAF detection limit. CAR = chimeric antigen receptor; VAF = variant allele frequency.

