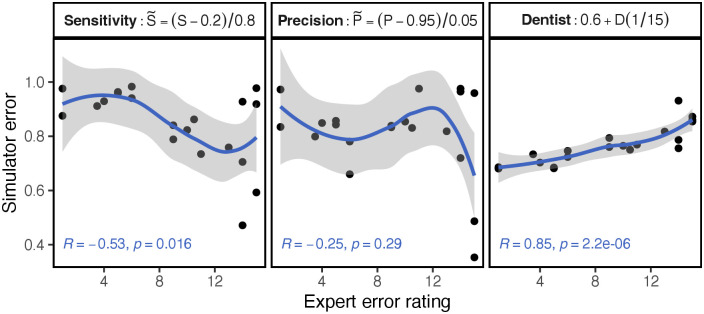
Fig 5. Correlation of our metric and the basic metrics.
The line is a polynomial regression to illustrate the different curvatures. There is a high correlation of our scoring metric with the ratings of two independent experts’. In this graph, we show the metric in the value range of [0, 1], with 1 as ideal, to compare with other similarity metrics. In general however, the scoring metric is chosen to be in the range of [0, 15], with 0 as the ideal outcome, same as the dentist’ rating system.

