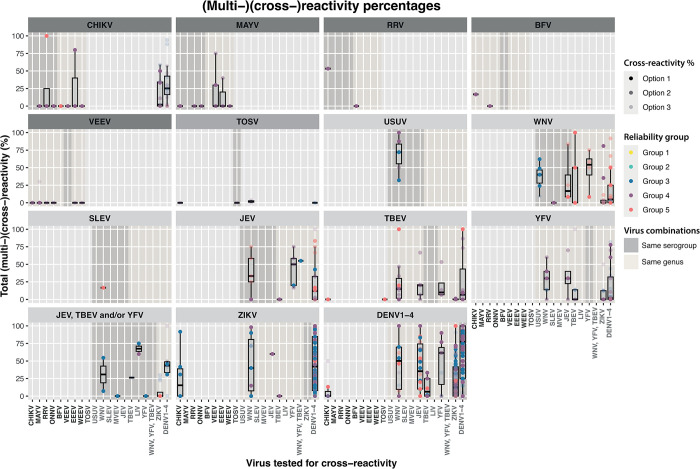
Fig 7. Reliability of arbovirus cross-reactivity results mapped to antigenic distance.
Calculated percentage of cases exposed to different arboviruses for which (multi-)(cross-)reactive antibodies were found to viruses listed at the bottom of the panels. The heading of each panel depicts the arbovirus(es) of exposure. Coloured circles indicate the scoring from group 1 (highest) to 5 (lowest) (yellow, turquoise, dark blue, purple and pink, respectively). The transparency of the circles corresponds to the different options of calculated cross-reactivity percentages. The blue overlays depict which arboviruses tested for cross-reactivity are in the same serogroup as the arbovirus of exposure, whereas the dark grey overlays show which arboviruses are within the genus of the arbovirus of exposure. *YFV, TBEV, JEV represents all different combinations of two of these viruses or all.

