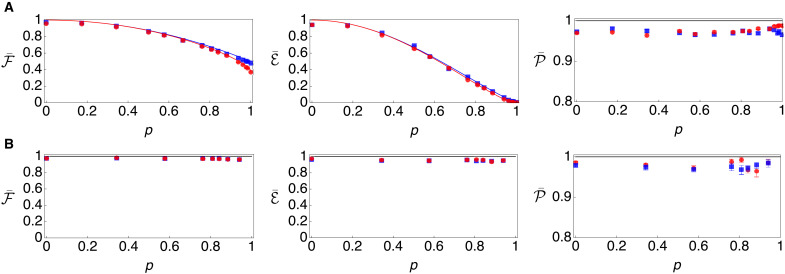
Fig. 4. Recovery of quantum entanglement.
Properties of the quantum states (A) before and (B) after applying reversal measurements (average fidelity , average entanglement of formation , and average purity ). The measurement strengths for Alice and Bob are set to be identical (p = pA = pB). Dots and lines are the experimental data and the ideal theory graphs, respectively, where blue is for witness and quantum steering, and red is for Bell nonlocality. Black lines are used if their theory graphs are identical. Error bars denote 1 SD.

