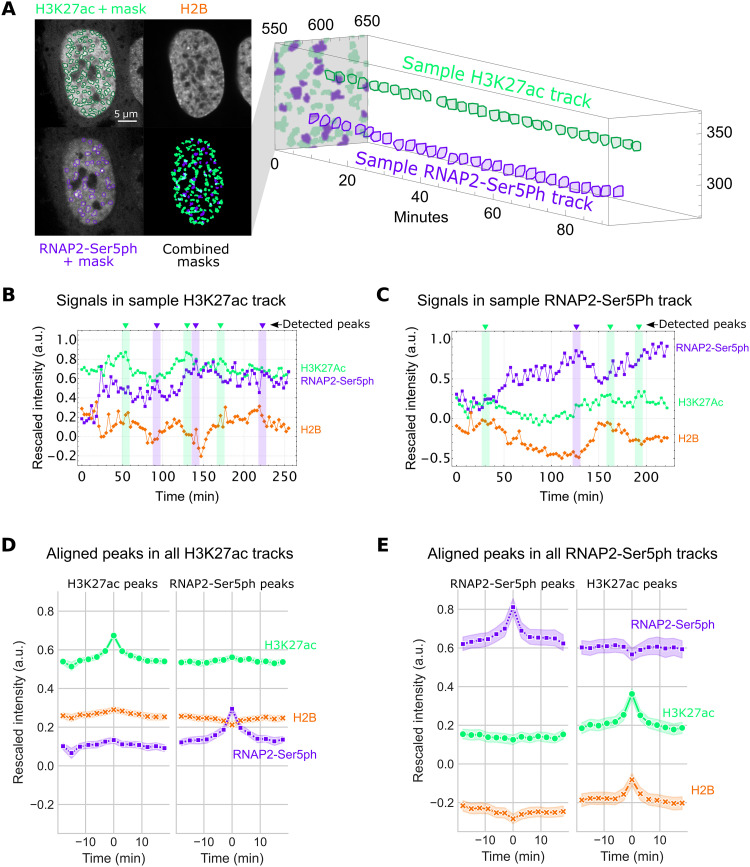
Fig. 2. Hours-long tracking of chromatin regions enriched for H3K27ac and RNAP2-Ser5ph.
(A) Left: A local adaptive binarization filter is used to identify and isolate regions of chromatin enriched for specific PTMs. Right: Enriched regions are tracked through time. An individual sample of H3K27ac-enriched and RNAP2-Ser5ph–enriched tracks is shown. (B) Time traces from a sample track of chromatin enriched for H3K27ac, with average levels of H3K27ac, RNAP2-Ser5ph, and H2B within the region plotted. Identified peaks within H3K27ac and RNAP2-Ser5ph signals are labeled in green and purple, respectively. (C) Same as (B), for RNAP2-Ser5ph–enriched region. (D) Left: Aligned H3K27ac (n = 2228 peaks) peaks from all H3K27ac-enriched chromatin tracks (n = 10,290 tracks total; n = 2743 greater than 30 frames). All signals were aligned on the basis of the detected peak’s time points. Right: Aligned RNAP2-Ser5ph detected peaks (n = 2387) in the same tracks. Error is 95% confidence interval (CI). (E) Left: Aligned RNAP2-Ser5ph peaks (n = 874 peaks) from all RNAP2-Ser5ph–enriched chromatin tracks (n = 5005 tracks total; n = 965 greater than 30 frames). All signals were aligned on the basis of the detected peak’s time points. Right: Aligned H3K27ac peaks (n = 683) in the same tracks. Error is 95% CI.

