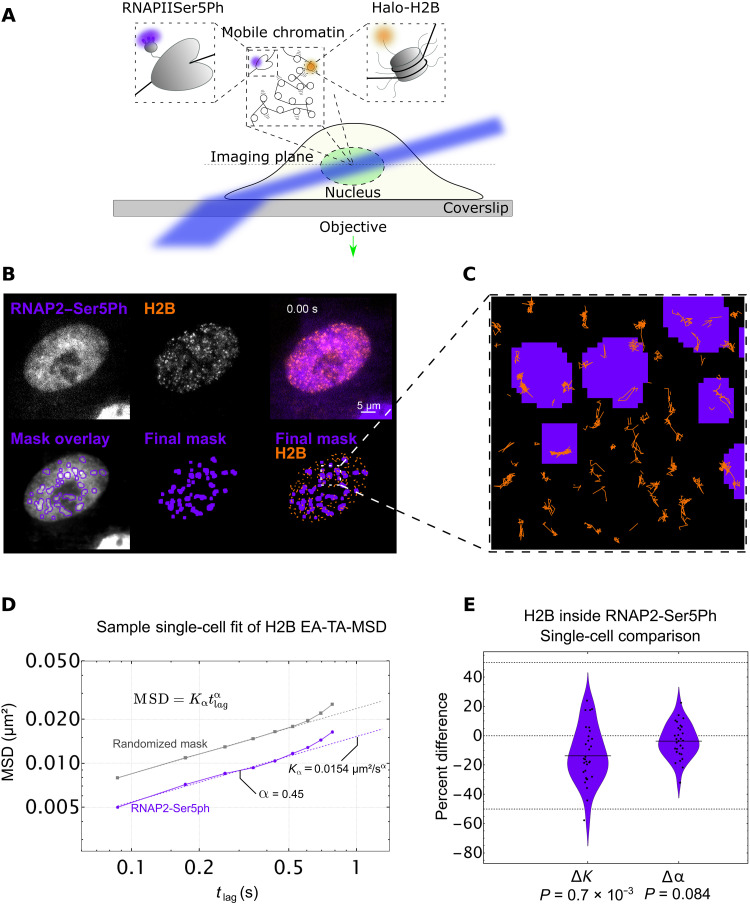
Fig. 3. Single-particle tracking of H2B located within transcriptionally active regions marked by RNAP2-Ser5ph.
(A) Imaging scheme for single-particle H2B tracking experiments using HILO microscopy setup. A combination of H2B-Halo and Fab specific for RNAP2-Ser5ph is used to track single molecules of H2B in the context of transcription. (B) Top row, left: Sample single frame of RNAP2-Ser5ph Fab in living RPE1 cells. Middle: Sample single frame of single-molecule H2B-Halo in the same cell. Right: Colored composite of RNAP2-Ser5ph and H2B channels in purple and orange, respectively. Bottom row, left: Outlines of RNAP2-Ser5ph local adaptive binarization mask overlaid upon the 100-frame average image from which the mask was extracted. Middle: Single local adaptive binarization mask of RNAP2-Ser5ph–enriched regions. Right: RNAP2-Ser5ph mask with overlaid H2B-Halo tracks in orange. (C) Selected zoom from (B) showing sample full traces of Halo-H2B tracks occurring both inside and outside RNAP2-Ser5ph–enriched regions. (D) Sample single-cell fit for the ensemble MSD of all H2B tracks lasting 10 frames or longer, localized in a randomized mask control (gray, n = 5860 total tracks across 10 randomizations) or in RNAP2-Ser5ph–enriched, transcriptionally active regions (purple, n = 463 tracks). Determined diffusion coefficient (Kα) and alpha coefficient (α) for this single-cell fit are labeled, which contributes a single point to (E). Error bars are SEM. (E) Difference in K (ΔK) and α (Δα) for RNAP2-Ser5ph–enriched regions versus a randomized mask control. Each data point represents the difference in fit coefficients for a single-cell fit (n = 31 cells), relative to the mean value, with each cell comprising hundreds to thousands of H2B tracks. Significance determined via Student’s t test.

