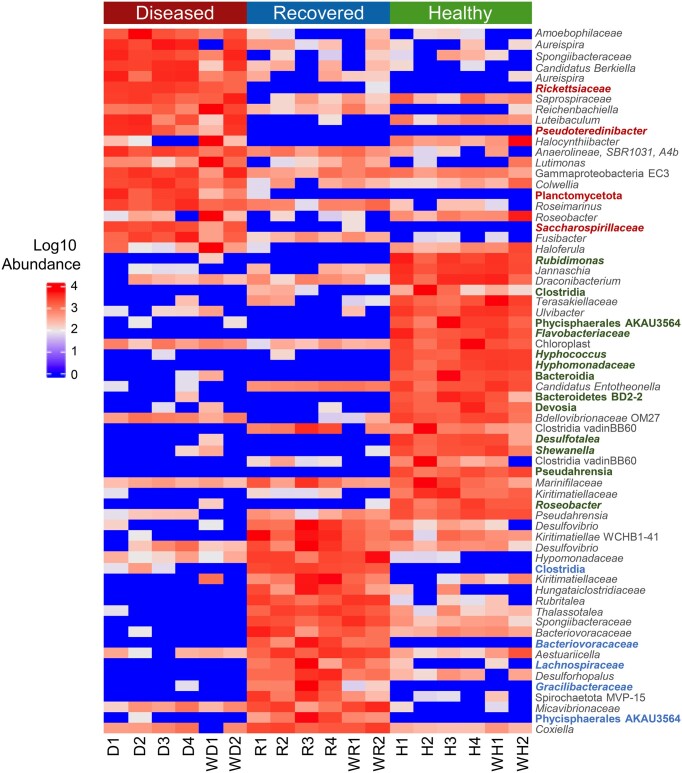
Figure 6.
Many microbial taxa are significantly differentially abundant among the groups. A heatmap shows the relative abundance of the taxa in each sample within the three groups including the water samples. Identified taxa are ASVs and the lowest known taxonomic classification is listed. Taxonomic names that are colored have a notably reduced abundance or are completely absent in the other two group microbiomes. The taxa displayed have an LDA score of > 3.1 based on identification by LEfSe. All taxa with an LDA score of > 3.0 along with their LDA score and P-values are available in Supplementary Data File 2; Table S7 (Supporting Information). The threshold was increased for better visualization of the data.

