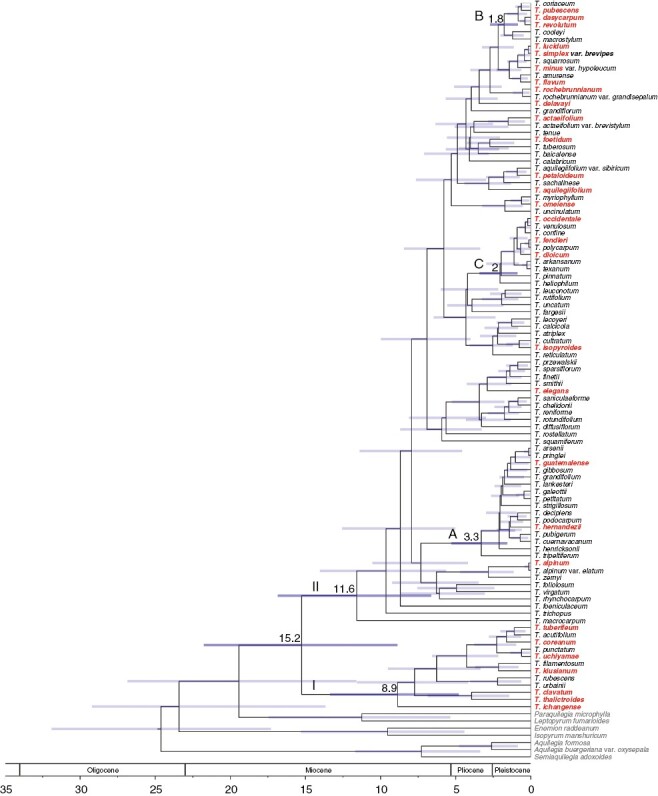
Fig. 1.

Thalictrum (Ranunculaceae) chronogram, showing Bayesian phylogeny and divergence time estimates for 99 Thalictrum taxa and seven outgroups based on the analysis of six combined plastid regions in BEAST. Estimated mean ages (for main clades) and 95 % highest posterior density intervals are shown at nodes. Two major clades, I and II, and three subclades with andromonoecious (A) and dioecious (B and C) members are indicated. Taxa used for flower trait analyses are shown in red. Geological epochs are after Walker et al. (2018).
