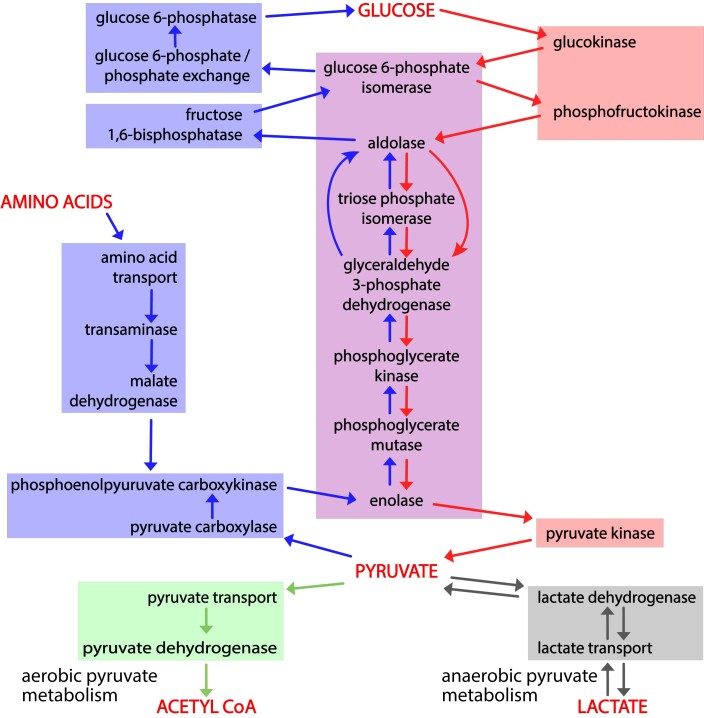
Fig. 2.
Causal connections among gene products that mediate glycolysis, gluconeogenesis, and pyruvate metabolism. Activity flow representation of the pathways of glycolysis, gluconeogenesis, and pyruvate catabolism, showing gene products (Table 1) associated with each process. The enzymes or transporters that mediate the generation of each required small molecule in these processes are connected by arrows to the ones that consume it. Red arrows connect the steps of glycolysis; blue arrows the steps of gluconeogenesis, and green and gray arrows the steps of aerobic and anaerobic pyruvate metabolism. Red shading highlights enzymes and transporters unique to glycolysis; blue shading enzymes and transporters unique to gluconeogenesis; and purple shading enzymes shared by the 2. The green and gray boxes, respectively, indicate the reactions that convert pyruvate to acetyl-CoA or lactate.

