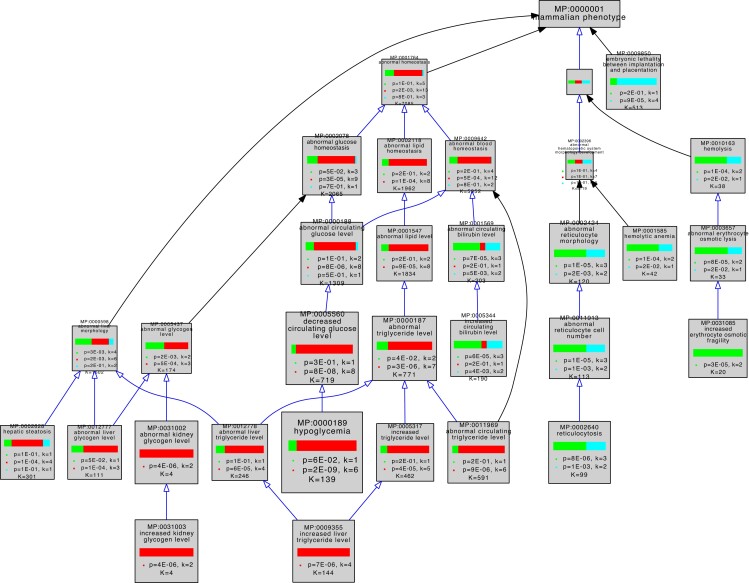
Fig. 3.
Graphical view of VLAD comparative enrichment analysis for mammalian phenotype annotation data from 2023 January 26. Three gene sets were used for the analysis as follows: glycolysis (green), gluconeogenesis (red), and genes shared between glycolysis and gluconeogenesis (blue) (Table 1). Blue arrows indicate a direct is_a relationship between terms, and black arrows indicate that the terms are indirectly related. As indicated in Table 1, 1 glycolysis-only gene (Pfkp MGI:1891833) and 5 shared genes (Pgk1 MGI:97555, Pgam2 MGI:1933118, Eno1b MGI:3648653, Eno2 MGI:95394, and Eno3 MGI:95395) have not been associated with any variant phenotypes and so were excluded from this analysis. Phenotypes in the domains of homeostasis, embryonic lethality, and hematopoietic system are shown. This graph shows the top 25 phenotypes based on enrichment score for clarity. The complete results of this VLAD analysis are tabulated in Table S1.

