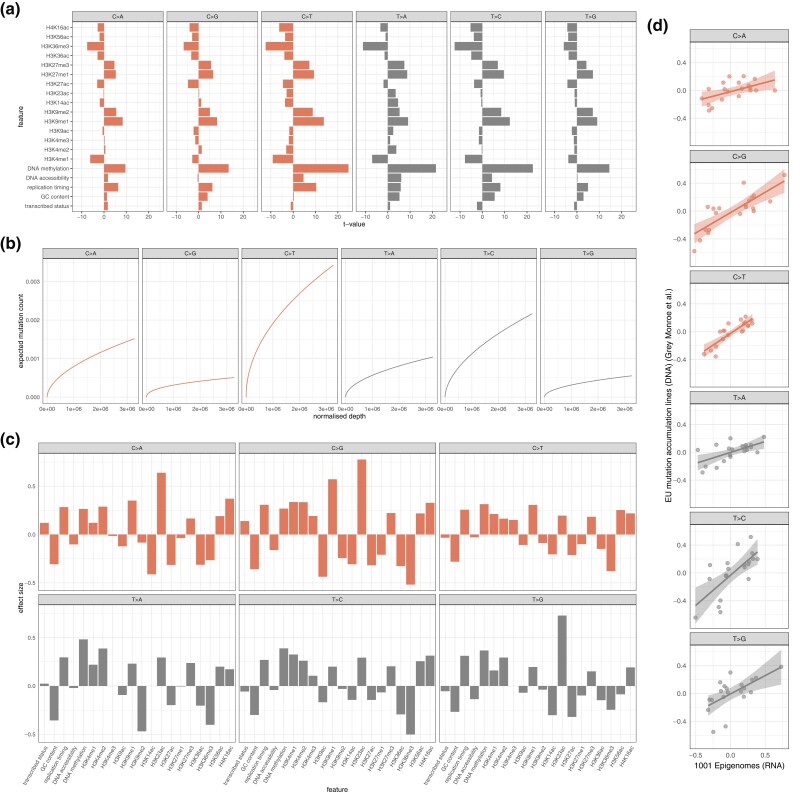
Fig. 6.
a) t-values resulting from partial correlation of each predictor covariate with mutations (normalized by effective gene length) conditioned upon log normalized depth. b) Intercept and normalized depth dynamics across interval of normalized depth values for each mutation type as per multivariate model. c) Estimated effect sizes for each covariate for each mutation type as per multivariate model; parameter values estimated with a cross-validation tuned LASSO penalty. d) Correlation of effect sizes estimated from 1001 Epigenomes (RNA) inferred somatic mutations and European mutation accumulation lines (DNA) (Monroe et al.’s data) inferred somatic mutations for each mutation type as per multivariate models.

