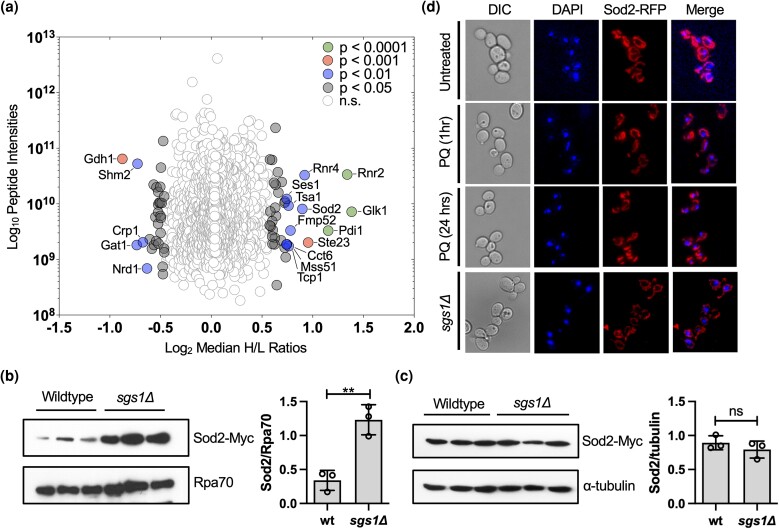
Fig. 1.
Cellular response to SGS1 deletion. a) SILAC-based quantitative proteomic analysis comparing chromatin-enriched fractions of wild-type cells and the sgs1Δ mutant. SILAC analysis was performed in triplicate with the median ratios (H/L) of heavy-labeled (sgs1Δ) to light-labeled (wildtype) proteins relative to protein abundance (estimated by summed peptide intensities) represented in this plot. The overall median ratios obtained from the entire dataset were used to demonstrate statistical significance based on magnitude fold-change (SigA test, P < 0.05). Details of additional statistical filtering are provided in Materials and Methods section. For a list of all proteins that significantly changed in the sgs1Δ mutant, see Supplementary Table 2 b) Western blot and quantification of Sod2-myc levels in 3 independent chromatin-enriched fractions from wild-type cells and the sgs1Δ mutant. Rpa70 was used as a loading control. The ratio between Sod2-myc and RPA70 is reported with standard deviation. c) Western blot and quantification of Sod2-myc expression levels in 3 independent whole-cell extracts from wild-type cells and the sgs1Δ mutant. α-tubulin was used as a loading control. The ratio between Sod2 and tubulin is reported with a standard deviation. d) Fluorescence microscopy images of RFP-tagged Sod2 and DAPI staining in wildtype cells in the absence and presence of PQ and in the absence of Sgs1 (sgs1Δ). The statistical significance of differences in b) and c) was determined with a Student's t-test and reported as **P ≤ 0.01; ns, not significant.

