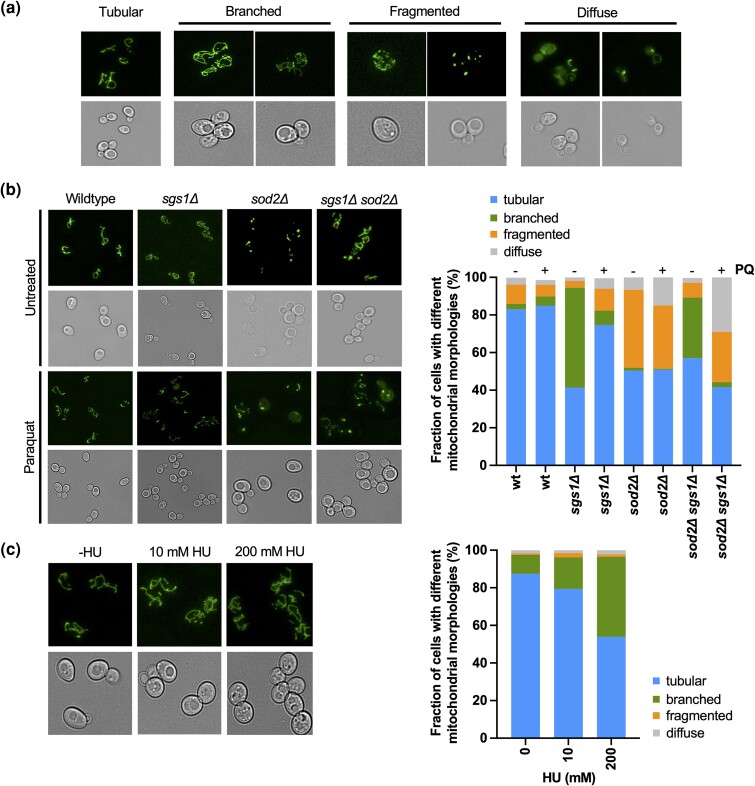
Fig. 2.
Changes in mitochondrial morphology upon deletion of SGS1 and/or SOD2 in the presence or absence of PQ. a) Overview of the 4 major mitochondrial morphologies (tubular, branched, fragmented, diffuse) we observed in wildtype cells or the sgs1Δ and sod2Δ mutants in the presence or absence of PQ (0.03 mM). Mitochondria were visualized by tagging mitochondrial aconitase Aco1-GFP, followed by fluorescence microscopy. b) Left panel: Representative images of different mitochondrial morphologies in wildtype and sgs1Δ and sod2Δ mutants in the presence and absence of PQ (0.03 mM). Mitochondria were visualized by GFP-tagging Aco1, followed by fluorescence microscopy. Right panel: The fraction of cells with either tubular, branched, fragmented, or diffuse mitochondrial morphology was determined from 3 experiments and a minimum of 100 cells of each strain and treatment condition. The mean is presented; for mean ± SD see Supplementary Table 3. c) Left panel: Representative images of mitochondrial morphology in wildtype cells treated with a low dose (10 mM) or high dose (200 mM) of HU. Mitochondria were visualized by GFP-tagging Aco1, followed by fluorescence microscopy. Right panel: The fraction of cells with either tubular, branched, fragmented, or diffuse mitochondrial morphology was determined from a minimum of 100 cells from 3 experiments performed in the absence of HU and for each HU concentration. The mean is presented; for mean ± SD see Supplementary Table 4.

