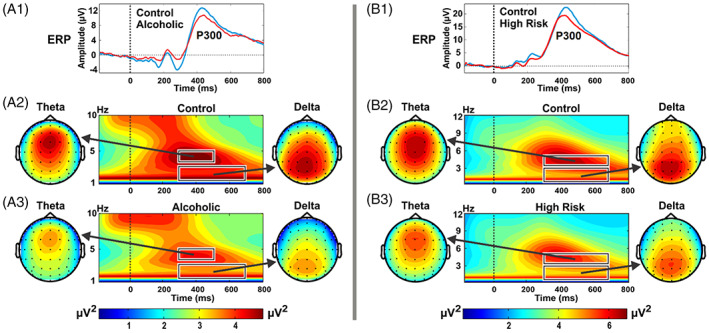
FIGURE 2.

Brain wave characteristics in individuals with AUD (left panels, A1–A3) and their children, who are at high risk to develop AUD, due in part to genetic influences through family history (right panels, B1–B3) during a mental task called a “visual oddball task” in which they were asked to press a button only to a specific “target” image on a computer screen, while ignoring other more frequent images. Brain responses only to the target stimulus are illustrated in this figure. In A1 and B1 (top panels) you can see that both individuals with AUD 35 , 77 (red lines, left panel) and their high‐risk children 36 from AUD families (red line, right panel) had smaller P3 or P300 waves (the large peak in top panel occurring between 300 and 700 ms after the target) compared to those unaffected (blue lines, left panel) and at low risk from community comparison families (blue lines, right panel). In A2 and A3, and B2 and B3 (middle and bottom panels) you can see the lower magnitude of brain waves oscillating at theta (4–7 Hz) and delta (1–3 Hz) frequencies during the P300 response in both individuals with AUD (left panel) and their high‐risk children (right panel) compared to those unaffected (left panel) and offspring from comparison community families (right panel); note that theta oscillations have a frontal focus while delta oscillations have a more posterior focus. These differences in brain wave characteristics between individuals affected compared to unaffected with AUD, and between offspring from AUD families compared to offspring from community comparison families indicate less activation and/or weaker synchronization of neural activity during this cognitive task in those with AUD and their high‐risk children.
