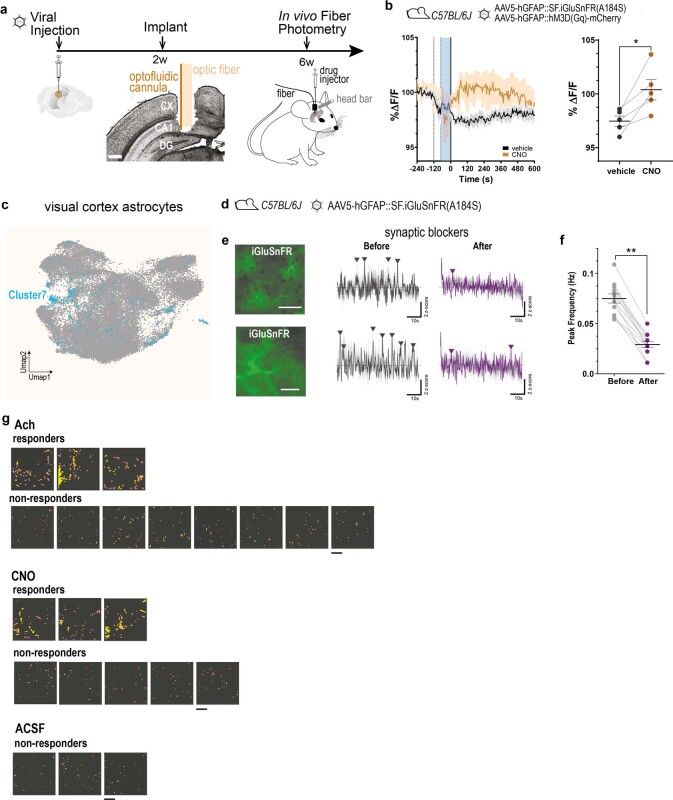
Extended Data Fig. 7. Astrocyte SF-iGluSnFR responses in awake mice recorded with fibre photometry in hippocampus and two-photon imaging in visual cortex, with additional information to Fig. 2.
a, Experimental paradigm for in vivo fibre photometry SF-iGluSnFR fluorescence measurements and local drug delivery through optofluid cannula positioned in the dorsal hippocampus, above DG. The whole-brain image is from the Allen Mouse Brain Connectivity Atlas (https://mouse.brain-map.org/). b, Top, viral injections for astrocyte expression of SF-iGluSnFR and Gq-DREADD in wild-type mice. Bottom, left: time course of averaged SF-iGluSnFR fluorescence responses to vehicle (black) and CNO (2.5 mM, brown), both in the presence of synaptic blockers mixture (Methods, n = 5 mice). Traces are aligned to the cannula plug (dotted line) and drug injection time (blue bar). Data are normalized to baseline and presented as mean ± s.e.m. Right, Normalized SF-iGluSnFR maximal fluorescence values in individual pairs at 3 minutes after application of vehicle and CNO. Lines represent mean ± s.e.m. (vehicle, black, mean: 97.5 ± 0.47; CNO, brown, mean: 100.4 ± 0.94). (*P = 0.02, two-tailed paired t test). c, Visual cortex UMAP representation of 1 mouse, 1 macaque and 1 human integrated visual cortex scRNA-seq datasets (Methods) annotated with a neural network classifier trained on a comprehensive database29 and subset for astrocyte population. Blue cells show the distribution of predicted cluster 7 according to the astrocyte reference annotation from the integrated astrocytic database in Fig. 1b. d–f, Two-photon imaging in vivo of the spontaneous SF-iGluSnFR activity in the visual cortex of the awake mouse before and after topical infusion of a synaptic blockers mixture (Methods). (n = 12 FOVs, 6 mice). d, Experiments performed in wild-type mice injected with AAV5-GFAP::SF.iGluSNFR(A184S) in the visual cortex e, Top, left to right: (i) mean projection of the SF-iGluSnFR fluorescence signal in a representative large FOV (151 µm x 151 µm) containing multiple astrocytes (137 µm below surface); scale bar: 50 µm. (ii) Effect of the synaptic blockers: left: traces (grey, original; black, filtered) of mean SF-iGluSnFR activity from all ROIs in the FOV during the 60s acquisition before incubation with synaptic blockers (before); arrowheads point to identified SF-iGluSnFR activity peaks based on peak duration and z-score (Methods). Right, traces (grey, original; violet, filtered) and SF-iGluSnFR activity peaks detected after incubation with synaptic blockers (after). Bottom, from left to right: (i) mean projection of the SF-iGluSnFR fluorescence signal in a representative small FOV (37.5 x 37.5 µm) containing in this case a single astrocyte (137 µm below surface); scale bar: 10 µm. (ii) Effect of the synaptic blockers: descriptive as in top part of the panel. n = 12 FOV, 6 mice. f, Summary reporting SF-iGluSnFR mean peak frequency before (grey,: mean: 0.75 ± 0.04 Hz) and after infusion of synaptic blockers (violet: 0.29 ± 0.03 Hz) for each tested FOV. The effect of synaptic blockers was significant in all FOVs (Wilcoxon rank sum test, two sided, **P = 0.0025 n = 12 FOV from 6 mice). Blockers mainly suppressed synchronized activity between cells and between ROIs within a cell, likely representing coordinate neuronal glutamate release responses to inherent patterns of cortical activity and inputs from other regions42. g, SF-iGluSnFR signal responses to Ach, CNO or ACSF in all astrocytes investigated in vivo in the visual cortex in 37.5 x 37.5 µm FOVs in the presence of synaptic blockers. Astrocytes are regrouped as responders or non-responders to the stimulus (Methods). For each astrocyte and for each stimulus is presented a colour-coded spatial map of the ROIs in the FOV displaying increased peak frequency upon stimulus application. The colour scale represents intensity of frequency increase above baseline, from 0 (pink) to 0.25 Hz (yellow); scale bar: 10 µm.

