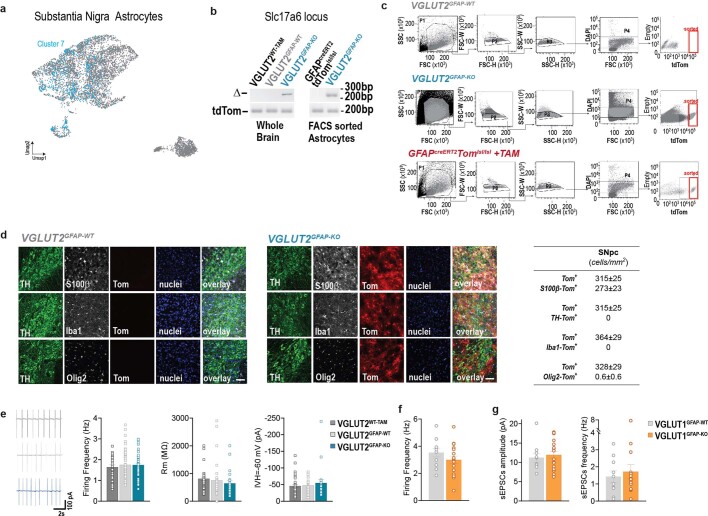
Extended Data Fig. 10. Additional data related to the GFAPcreERT2Slc17a6fl/fltdTomlsl/lsl mouse model, and the electrophysiology studies presented in Fig. 4.
a, UMAP representation of 2 integrated human and 1 mouse substantia nigra scRNA-seq datasets (Methods) annotated with a neural network classifier trained on a comprehensive database29. The UMAP represents the distribution of predicted cluster 7 (blue) according to astrocyte reference annotation from the integrated astrocytic database in Fig. 1b. b, Genomic PCR to validate deletion of the Slc17a6 locus (Δ) in VGLUT2GFAP-KO mice. Left, validation on whole brain homogenates of VGLUT2GFAP-KO, and of VGLUT2GFAP-WT and VGLUT2WT-TAM controls (n = 2 per group). Right, validation on FACS-sorted astrocytes from the midbrain region of VGLUT2GFAP-KO and of GFAPcreERT2tdTomlsl/lsl controls (n = 2 per group). c, Representative fluorescence activated cell sorting of tdTomato positive (Tom+) astrocytes in midbrain samples of VGLUT2GFAP-WT mice (sorted ≥2 x 10⁵ Tom+ cells per experiment, n = 2 independent experiments, 5 mice per experiment), VGLUT2GFAP-KO mice (sorted ≥2 x 10⁵ Tom+ cells per experiment, n = 2 independent experiments, 5 mice per experiment) and GFAPCreERT2tdTomlsl/lsl mice (sorted ≥2 x 10⁵ Tom+ cells per experiment, n = 2 independent experiments, 5 mice per experiment) See Methods for details. d, Left, Representative images, here acquired with confocal microscope, confirming no leakage in the absence of TAM-induced cre recombination, that is, lack of any Tom+ cells (red) in the SNpc of VGLUT2GFAP-WT and VGLUT2WT-TAM control mice also stained with the neuronal marker TH (green), the astrocyte marker S100β (grey), the oligodendrocyte marker Olig2 (grey) or the microglia marker Iba1 (grey), and the nuclear marker, DAPI (blue). Scale bar: 50 µm. Middle, confocal images confirming co-labelling of Tom+ cells (red) with the astrocyte marker S100β (grey) but not with the neuronal (TH, green) microglia (Iba1, grey) or oligodendrocyte (Olig2, grey) markers in the SNpc of VGLUT2GFAP-KO mice. Scale bar: 50 µm. Right, table presenting the total number of Tom+ cells and the relative numbers of the same Tom+ cells co-labelled with astrocyte (S100β), neuron (TH), oligodendrocyte (Olig2) or microglia (Iba1) markers, counted in SNpc of VGLUT2GFAP-KO mice after TAM-induced cre recombination. n = 12 images, 2 independent experiments, 3 mice. e, Left: representative cell-attached firing traces and Right, histograms of basal electrophysiological properties (firing frequency, membrane resistance (Rm) and holding current at –60 mV) of SNpc DA neurons in midbrain slices from VGLUT2GFAP-KO, VGLUT2GFAP-WT and VGLUT2WT-TAM mice. Data are presented as mean ± s.e.m. (firing frequency: VGLUT2GFAP-KO, n = 59 cells, 9 mice; VGLUT2GFAP-WT, n = 58 cells, 8 mice; VGLUT2WT-TAM, n = 26 cells, 8 mice; Rm and Ihold at −60 mV: VGLUT2GFAP-KO, n = 23 cells, 9 mice; VGLUT2GFAP-WT, n = 29 cells, 8 mice; VGLUT2WT-TAM mice, n = 38 cells, 8 mice). No differences among groups were observed: one-way ANOVA: P = 0.7399 for firing frequency; P = 0.47 for Rm; P = 0.516 for holding current at −60 mV. f, Plot of spontaneous firing frequency recorded in cell-attached mode in SNpc DA neurons of VGLUT1GFAP-KO (n = 18 cells, 3 mice) and VGLUT1GFAP-WT (n = 11 cells, 3 mice). No significant differences were found between the two groups: P = 0.228, unpaired Student’s t test, two tails. Data are presented as mean ± s.e.m. g, Histograms of frequency and amplitude of spontaneous excitatory postsynaptic currents (sEPSCs) recorded in SNpc DA neurons of VGLUT1GFAP-KO (n = 17 cells, 3 mice) and VGLUT1GFAP-WT (n = 10 cells, 3 mice). Data are presented as mean ± s.e.m. and show no differences between the two groups. P = 0.63 for sEPSC frequency and P = 0.64 for sEPSC amplitude, unpaired Student’s t test, two-tails.

