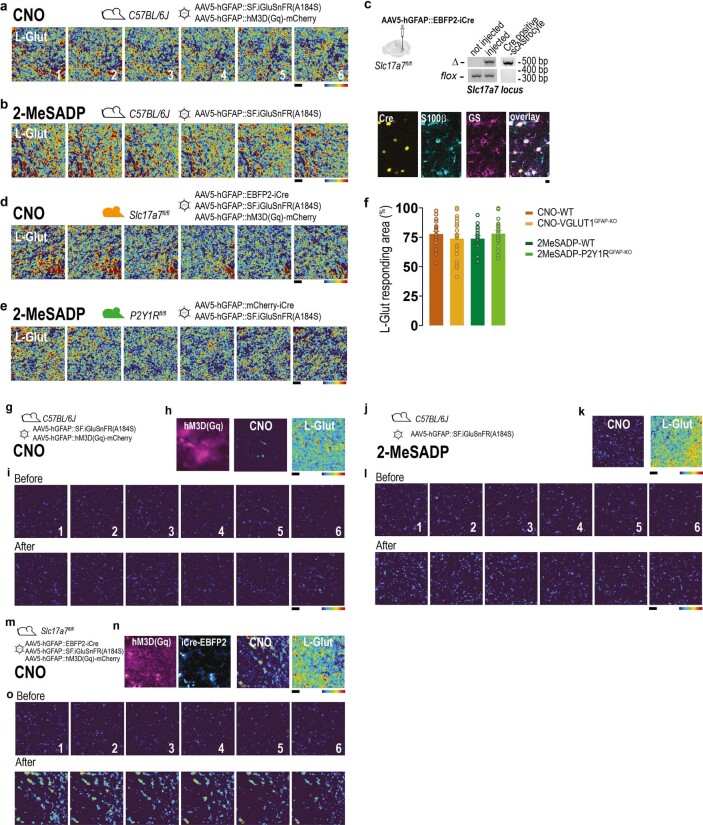
Extended Data Fig. 4. Additional data related to the glutamate imaging studies in situ presented in Fig. 2.
a, 6 mean projections showing the individual SF-iGluSnFR responses to 6 L-Glut puffs onto the same FOV as the wild-type CNO-responder shown in Fig. 2c–e. Each image is a pixel-by-pixel map of the SF-iGluSnFR signal after the L-Glut application. Amplitude of the responses in individual pixels is expressed in z-scores scale and colour coded, going from 0 (dark blue) to 6 (red). Note the responsiveness of most of the FOV. b, 6 mean projections showing the individual SF-iGluSnFR responses to 6 L-Glut puffs onto the same FOV as the wild-type 2MeSADP-responder shown in Fig. 2g–i. c, Validation of VGLUT1 deletion in astrocytes (VGLUT1GFAP-KO); Top left, strategy to obtain cre-mediated VGLUT1 deletion in astrocytes through injection of AAV5-hGFAP::EBFP2iCre into the hippocampus of Slc17a7fl/fl mice. The whole-brain image is from the Allen Mouse Brain Connectivity Atlas (https://mouse.brain-map.org/). Right, top, validation by genomic PCR revealing Slc17a7 locus deletion (Δ band in all gels) in brains of virally-injected and not injected Slc17a7fl/fl mice (n = 2 independent biological brain samples per group), or in cre-positive, blue-fluorescent DGML astrocytes individually collected with a patch pipette (n = 2 cells, 1 mouse). Bottom, co-labelling of cre-expressing cells (yellow, false colour for EBFP2-expressing, blue-fluorescent cells) with S100β (cyan) and GS (magenta) astrocytic markers. Scale bar: 5 µm. d, 6 mean projections showing the individual SF-iGluSnFR responses to 6 L-Glut puffs onto the same FOV as the VGLUT1GFAP-KO not responding to CNO shown in Fig. 2k,l. e, 6 mean projections showing the individual SF-iGluSnFR responses to 6 L-Glut puffs onto the same FOV as the P2Y1RGFAP-KO not responding to 2MeSADP shown in Fig. 2n,o. f, Proportion of the imaged FOV responding to sequential L-Glut administrations after either CNO or 2MeSADP administrations for all the tested cells in the mouse groups as in Fig. 2p. Responses to L-Glut in VGLUT1GFAP-KO or P2Y1RGFAP-KO mice do not differ from those in wild-type mice. Data presented as mean ± s.e.m. WT, n = 23 cells, 5 mice; VGLUT1GFAP-KO mice, n = 24 cells, 5 mice. 2MeSADP-stimulated astrocytes: WT, n = 18 cells, 2 mice; P2Y1RGFAP-KO, n = 20 cells, 2 mice. g–i, Example of a wild-type CNO non-responder; g, viral injections as in Fig. 2b. h, Left, mean projection showing Gq-DREADD-mCherry expression pattern, resembling the one seen in CNO-responders (Fig. 2c). Middle, Standard deviation (s.d.) projection displaying the signal variance across 6 CNO stimulations, showing no CNO-evoked SF-iGluSnFR response. Right, S.d. projection showing reliable responses to L-Glut applications for the same FOV. i, 6 mean projections showing the individual SF-iGluSnFR responses to 6 CNO puffs in the same cell as in h. Each image is a pixel-by-pixel colour-coded z-score map of the SF-iGluSnFR signal in the FOV during the 240s before and after the CNO application. j-l, Example of a wild-type 2MeSADP non-responder; j, viral injections as in Fig. 2f; k, Left, S.d. projection displaying the signal variance across 6 2MeSADP stimulations, showing no 2MeSADP-evoked SF-iGluSnFR response. Right, S.d. projection showing reliable responses to L-Glut application for the same FOV. l, 6 mean projections showing the individual SF-iGluSnFR responses to 6 2MeSADP puffs in the same cell as in k. Details as in panel i. m-o, Example of a VGLUT1GFAP-KO astrocyte classified as CNO responder (n = 3/24 cells); m, mouse line and viral treatments as in Fig. 2j; n, Images from left to right: (i) mean projection showing Gq-DREADD-mCherry expression pattern (magenta); (ii) mean projection showing EBFP2-iCre expression (blue) within the same FOV; (iii) S.d. projection displaying the signal variance across 6 CNO stimulations, showing some SF-iGluSnFR response to CNO; (iv) S.d. projection showing reliable responses to L-Glut application for the same FOV. o, 6 mean projections showing the individual SF-iGluSnFR responses to 6 CNO puffs in the same cell as in n. Details as in panel i. Responses are smaller than in CNO responder cells from wild-type mice: quantitative comparison in Fig. 2q

