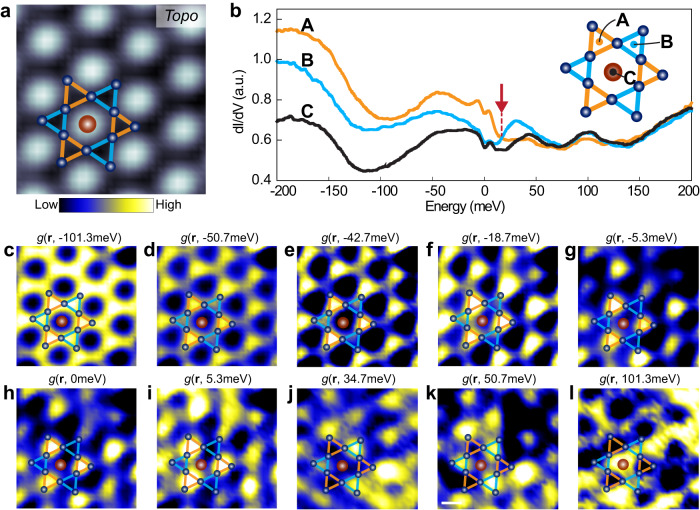
Fig. 3. Trimerized Kagome lattice on the Fe3Sn layer.
a Topographic STM image of the Fe3Sn layer. Setpoint: V = 0.2 V, I = 5.0 nA. b dI/dV spectra taken at three representative sites labeled A, B, and C (inset). The red arrow marks the intensity reversal for the up-and down-triangles at 16.8 meV. c–l Differential conductance maps of the same location at the energies marked. Setpoint: V = 0.2 V, I = 5.0 nA. A ball-and-stick model of the Kagome lattice is overlaid on the STM image (a) and differential conductance maps (c–l).

