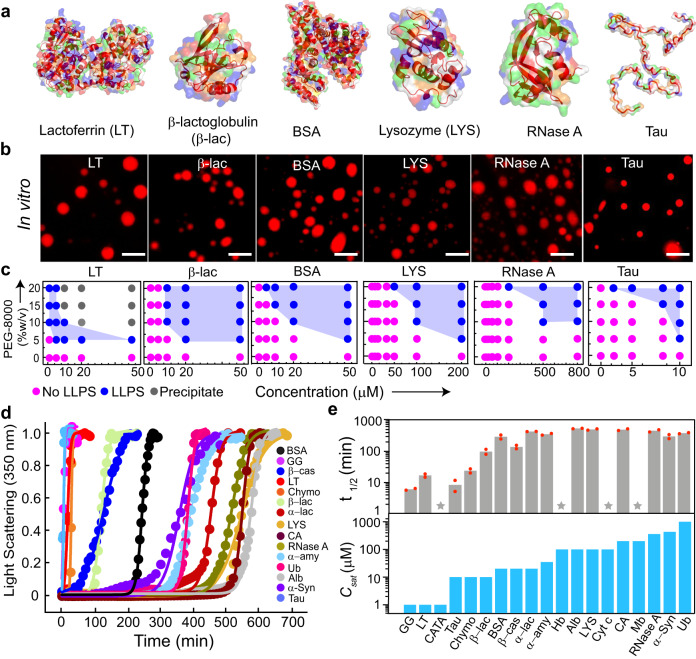
Fig. 1. Liquid-liquid phase separation of various proteins in vitro.
a Three-dimensional surface representation of selected proteins [LT (PDB ID: 1B0L), β-lac (PDB ID: 1QG5), BSA (PDB ID: 3V03), LYS (PDB ID: 1REX), RNase A (PDB ID: 1FS3), and Tau (PED00017e001)] with their embedded secondary structures (dark red). Positive, negative, and hydrophobic amino acids are represented in blue, red, and green colors, respectively. b Fluorescence microscopy images showing LLPS of selected NHS-Rhodamine labeled [10% (v/v) labeled to unlabeled] proteins (LT, β-lac, BSA, LYS, RNase A, and Tau) in the presence of 10% (w/v) PEG-8000. The samples were prepared in 20 mM sodium phosphate buffer (pH 7.4). Representative images are shown (n = 3, independent experiments). The scale bar is 5 µm. c Schematic representation showing the phase regime of selected proteins (LT, β-lac, BSA, LYS, RNase A, and Tau) LLPS at varying protein and PEG-8000 concentrations. The different states are represented with various color codes. The pink color indicates no LLPS (soluble state), the blue color indicates LLPS (condensate state), and the grey color indicates precipitation. The experiment was performed three independent times with similar observations. d Static light scattering experiment (at 350 nm) showing the kinetics of protein condensate formation with time at their Csat and in the presence of 10% (w/v) PEG-8000 (n = 2, independent experiments). The light scattering values were normalized to 1. e Top panel: t1/2 values depicting protein condensate kinetics determined from the sigmoidal fit from Fig. 1d. The data represent the mean for n = 2 independent experiments. Bottom panel: Csat of all proteins determined from the microscopic observation are represented with bar graphs. PEG-8000 was kept constant [10% (w/v)] to obtain a comparative measure of Csat of all the proteins. The star symbol represents chromophore-containing proteins for which the light scattering experiment was not performed. The Y-axis values are in the log scale. n = 3 independent experiments. Source data are provided as a Source Data file.

