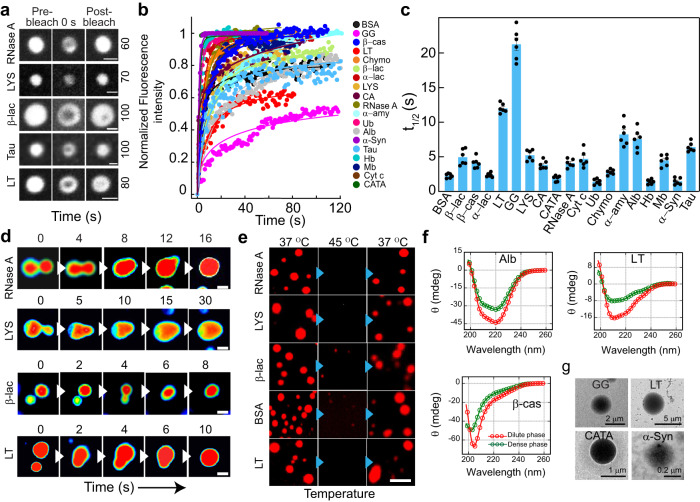
Fig. 3. Liquid-like properties of the various protein condensates.
a Representative images showing the liquid condensates (immediately after formation, 0 h) during FRAP [before bleaching, at bleaching (0 s), and after bleaching (respective recovery time shown at the right side in second)] for selected proteins (RNase A, LYS, β-lac, Tau and LT). The scale bar is 2 μm. The images are represented in the ‘grey’ lookup table (LUT) for better visualization. b Normalized FRAP curves (in arbitrary units) obtained for all the protein condensates at 0 h (immediately after LLPS) are plotted against time. n = 3 independent experiments were performed. c The bar plot of t1/2 values showing fluorescence recovery after photobleaching of protein condensates at 0 h. The data represent the mean ± s.e.m. for n = 3 independent experiments from multiple condensates. d Time-lapse images showing fusion events of condensates formed by selected proteins over time (RNase A, LYS, β-lac, and LT). Images are represented in ‘royal’ LUT for better visualization. Representative results are shown. The scale bar is 5 μm. The experiment was repeated two times. e Fluorescence microscopy images showing thermo-reversibility (37 °C → 45 °C → 37 °C) of selected NHS-Rhodamine labeled [10% (v/v)] protein condensates formed at their respective Csat in the presence of 10% (w/v) PEG-8000 (at 0 h). Representative images are shown. The experiment was performed two times with similar observations. The scale bar is 5 μm. f CD spectroscopic analysis of selected proteins (Alb, β-cas, and LT) showing no substantial changes in the secondary structural conformation of the dense and dilute phase of the proteins upon phase separation. The red and green colors indicate protein CD spectra of dilute and dense phases in the presence of PEG-8000 [10% (w/v)], respectively. n = 2, independent experiments were performed. g Representative TEM images showing the morphology of protein condensates formed by GG, LT, CATA, and α-Syn. n = 2 independent experiments were performed. Source data are provided as a Source Data file.

