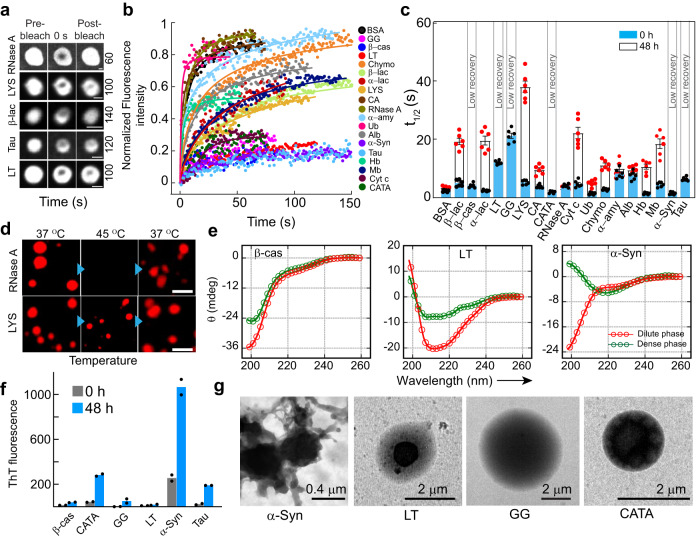
Fig. 4. The viscoelastic transition of protein condensates.
a Representative images showing selected protein condensates after LLPS (48 h) during FRAP analysis [(before bleaching, at bleaching (0 s), and after bleaching (respective recovery time shown at the right side in second)]. The images are represented in ‘grey’ LUT for better visualization. RNase A shows complete fluorescence recovery, whereas, LYS, β-lac, Tau and LT show partial recovery. The scale bar is 2 μm. b Normalized FRAP (in arbitrary units) profile of the phase separated condensates at 48 h by various proteins showing different fluorescence recovery. A subset of protein condensates after 48 h show reduced fluorescence recovery, indicating that they might undergo rigidification over time. n = 3 independent experiments were performed. c The t1/2 values were calculated from FRAP of all proteins at 0 h (blue) and 48 h (white), showing slow fluorescence recovery of protein condensates after 48 h. Notably, t1/2 values could not be calculated for β-cas, LT, GG, CATA, α-Syn and Tau due to the negligible recovery after photobleaching. The data represent the mean ± s.e.m. for n = 3 independent experiments. d Fluorescence microscopy image of NHS-Rhodamine labeled condensates (10% v/v) by RNase A (48 h) showing thermo-reversibility upon heating (45 °C) and cooling (37 °C). The LYS condensates did not dissolve upon heating, suggesting a viscoelastic transition after 48 h. The scale bar is 5 μm. Representative images are shown and the experiment was performed two times with similar observations. e CD spectra of selected proteins (β-cas, LT and α-Syn) demonstrating the secondary structure of the dilute (red) and dense (green) phases of proteins at 48 h (n = 2, independent experiments). f ThT fluorescence intensity (in arbitrary units) of different proteins immediately after LLPS (0 h) and after 48 h are shown. An increase in ThT intensity for α-Syn at 48 h suggests the formation of ThT positive, amyloid aggregates. The data represent the mean for n = 2 independent experiments. g TEM micrographs showing the appearance of multiphasic architectures by various protein condensates (α-Syn, LT, GG and CATA), while amyloid fibril formation by α-Syn condensate. n = 2 independent experiments were performed. Source data are provided as a Source Data file.

