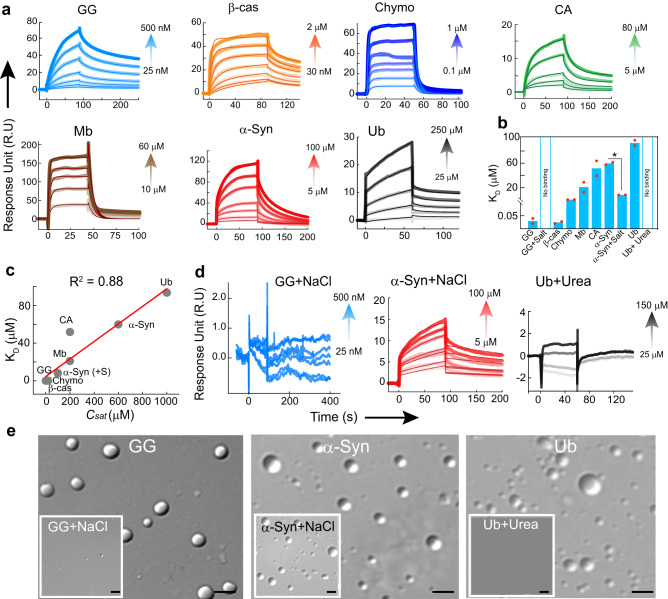
Fig. 6. Correlation of homotypic protein-protein interaction and phase separation by proteins.
a SPR sensogram of GG, Chymo and β-cas showing strong binding at low concentrations resulting in the low KD. CA and Mb showing moderate binding while α-Syn and Ub exhibits weak binding. n = 2, independent experiments were performed. b A bar graph representing KD of proteins. The data represent the mean for n = 2 independent experiments. The statistical significance was calculated using a two-tailed t-test (95% confidence interval) with no adjustments (p values, p < 0.001, p < 0.002, p < 0.033, and p > 0.12 indicated by (***), (**), (*) and (ns), respectively). The p value of α−Syn Vs α−Syn+salt is 0.023. c A correlation plot (R2 value: 0.88) between KD of proteins and their respective Csat showing a linear correlation. d SPR sensogram of GG and Ub showing drastic inhibition of the intermolecular interaction, in the presence of 150 mM salt and 2 M Urea, respectively. In contrast, α-Syn show a significant increase in inter-protein interaction (low KD) in the presence of 150 mM salt. n = 2, independent experiments were performed. e Representative DIC microscopy images of GG and α-Syn confirming the presence/absence of condensates in the presence/absence of NaCl. Ub showing no condensate formation in the presence of urea as compared to control (without urea). The experiment was performed three independent times with similar observations. The scale bar is 5 µm. Source data are provided as a Source Data file.

