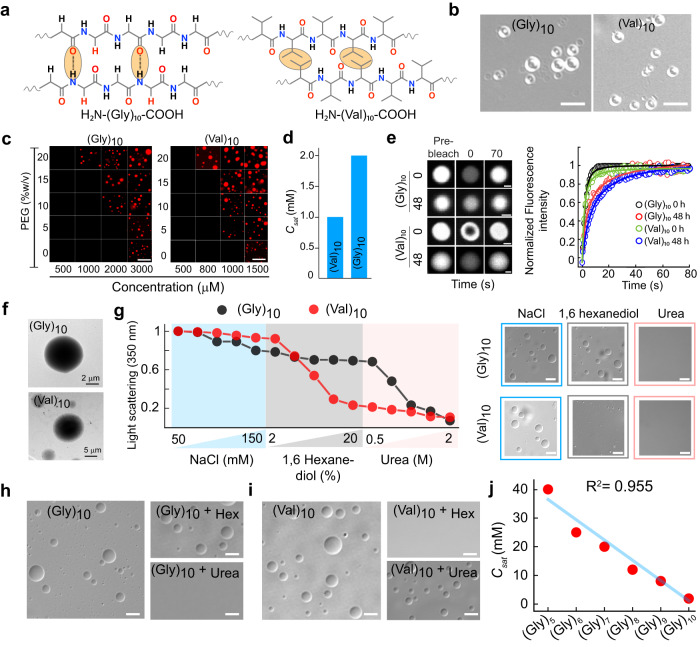
Fig. 7. Liquid-liquid phase separation of neutral homo polypeptides.
a Schematic representation showing the different possible modes of intermolecular interactions by homo-polypeptides by Gly and Val for their LLPS. b Representative DIC microscopy images showing condensate formation by (Gly)10 and (Val)10 at 2 mM and 1 mM concentration, respectively in the presence of 10% (w/v) PEG-8000. The scale bar is 5 µm. The experiment was performed three independent times with similar observations. c The phase regime of NHS-Rhodamine labeled polypeptides [1:10 (v/v) of labeled versus unlabeled peptide] at varying PEG-8000 and polypeptide concentrations in 20 mM sodium phosphate buffer at pH 7.4. The scale bar is 5 μm. The experiment was performed three independent times with similar observations. d Bar graph representing Csat of (Gly)10 and (Val)10 in the presence of 10% (w/v) PEG-8000. e Left: Representative FRAP images (before bleaching, at bleaching, and after bleaching) of (Gly)10 and (Val)10 condensates at 0 h and 48 h (represented in ‘grey’ LUT). The scale bar is 2 μm. Right: Normalized FRAP (in arbitrary units) profile showing complete fluorescence recovery of the phase separated condensates (at 0 h and 48 h) of polypeptides (Gly)10, and (Val)10 (n = 3, independent experiments). f Representative TEM images of (Gly)10 and (Val)10 condensates formed immediately after LLPS (0 h). n = 2, independent experiments were performed. g Left panel: Static light scattering measurements of polypeptides at 350 nm showing the effect of increasing concentration of various additives at LLPS condition. To carry out the experiment, the LLPS mixture of (Gly)10 and (Val)10 at Csat in the presence of 10% (w/v) PEG-8000 are treated with increasing concentration of NaCl (50–150 mM), followed by 1,6 hexanediol (2–20% w/v) and urea (0.5–2 M), respectively. Right panel: Representative DIC images confirming the absence or presence of condensates in the presence of additives during the light scattering experiment. The scale bar is 5 µm. The experiment was repeated twice with similar observations. h, i Representative DIC images of (Gly)10 and (Val)10 showing the effect of 1,6 hexanediol and urea for the phase separation. Respective polypeptides at Csat are used as control. The scale bar is 5 µm. The experiment was repeated two times with similar observations. (j) A correlation plot of Csat and length of (Gly)n polypeptides (R2 value: 0.955) suggests that with an increase in the Gly polypeptide length, the Csat decreases linearly. The experiment was repeated twice with similar observations. Source data are provided as a Source Data file.

