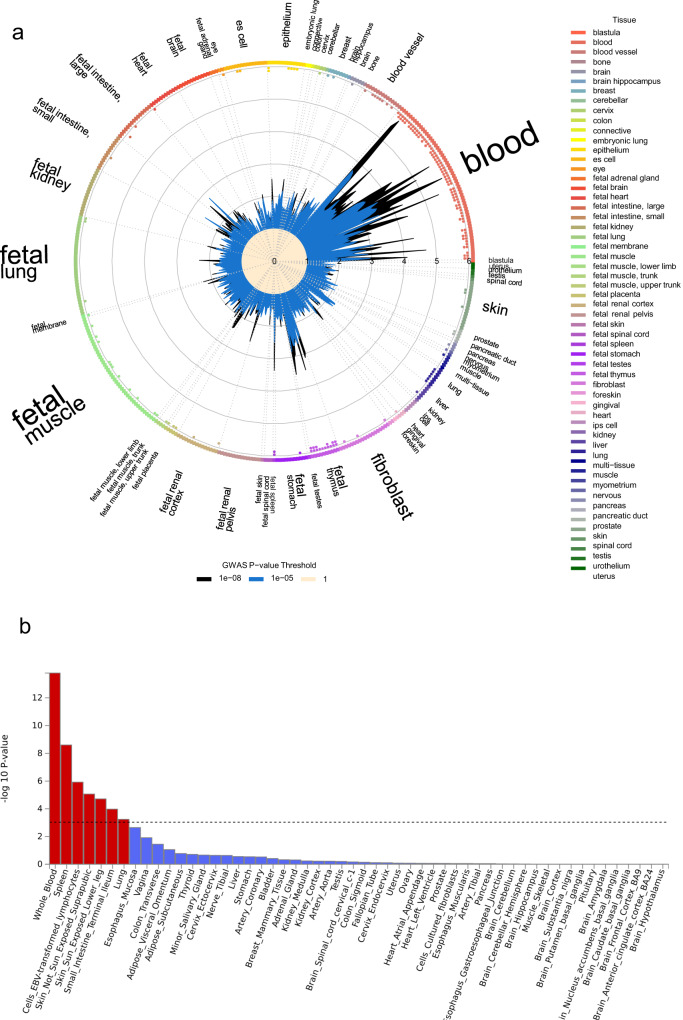
Fig. 2. Cell type tissue enrichment analysis.
a GARFIELD enrichment analysis of open chromatin data. Plot shows enrichment for AD associated variants in DNase I Hypersensitive sites (broad peaks) from ENCODE and Roadmap Epigenomics datasets across cell types. Cell types are sorted and labelled by tissue type. ORs for enrichment are shown for variants at GWAS thresholds of P < 1 × 10⁻⁸ (black) and P < 1 × 10⁻⁵ (blue) after multiple-testing correction for the number of effective annotations. Outer dots represent enrichment thresholds of P < 1 × 10⁻⁵ (one dot) and P < 1 × 10⁻⁶ (two dots). Font size of tissue labels corresponds to the number of cell types from that tissue tested. b MAGMA enrichment analysis of gene expression data. Plot shows P-value for MAGMA enrichment for AD associated variants with gene expression from 54 GTEx ver.8 tissue types. The enrichment –log10(P-value) for each tissue type is plotted on the y-axis. The Bonferroni corrected threshold P = 0.0009 is shown as a dotted line and the 7 tissue types that meet this threshold are highlighted as red bars.

