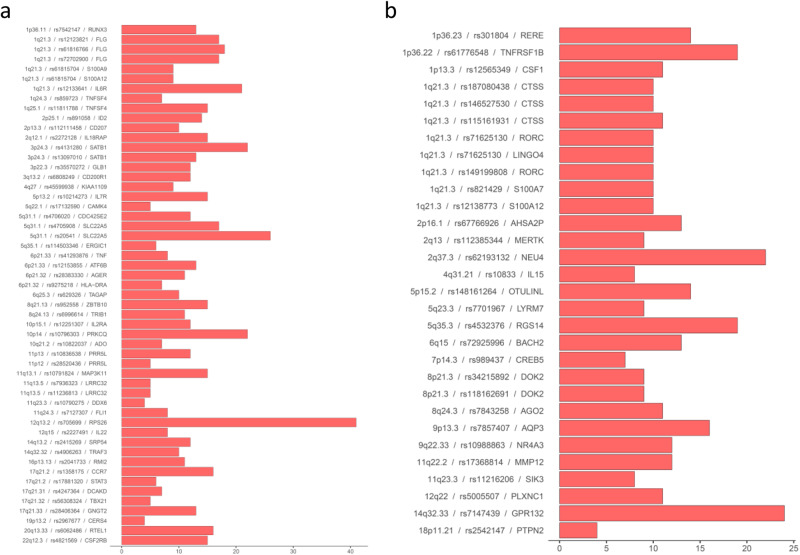
Fig. 3. Prioritised genes at GWAS loci.
Prioritised genes at known (a) and novel (b) loci. For each independent GWAS locus the top prioritised gene (or genes if they were tied) from our bioinformatic analysis is presented along with a bar representing the total evidence score for that gene. A more detailed breakdown of the constituent parts of this evidence score is presented in Supplementary Fig. 5 and the total evidence scores for the top 3 genes at each locus are presented in Supplementary Data 10. NB. There are some cases of two independent GWAS signals implicating the same gene.

