
Figure 4. Macrophages produce BAFF and are differentially responsive to BAFF and APRIL.
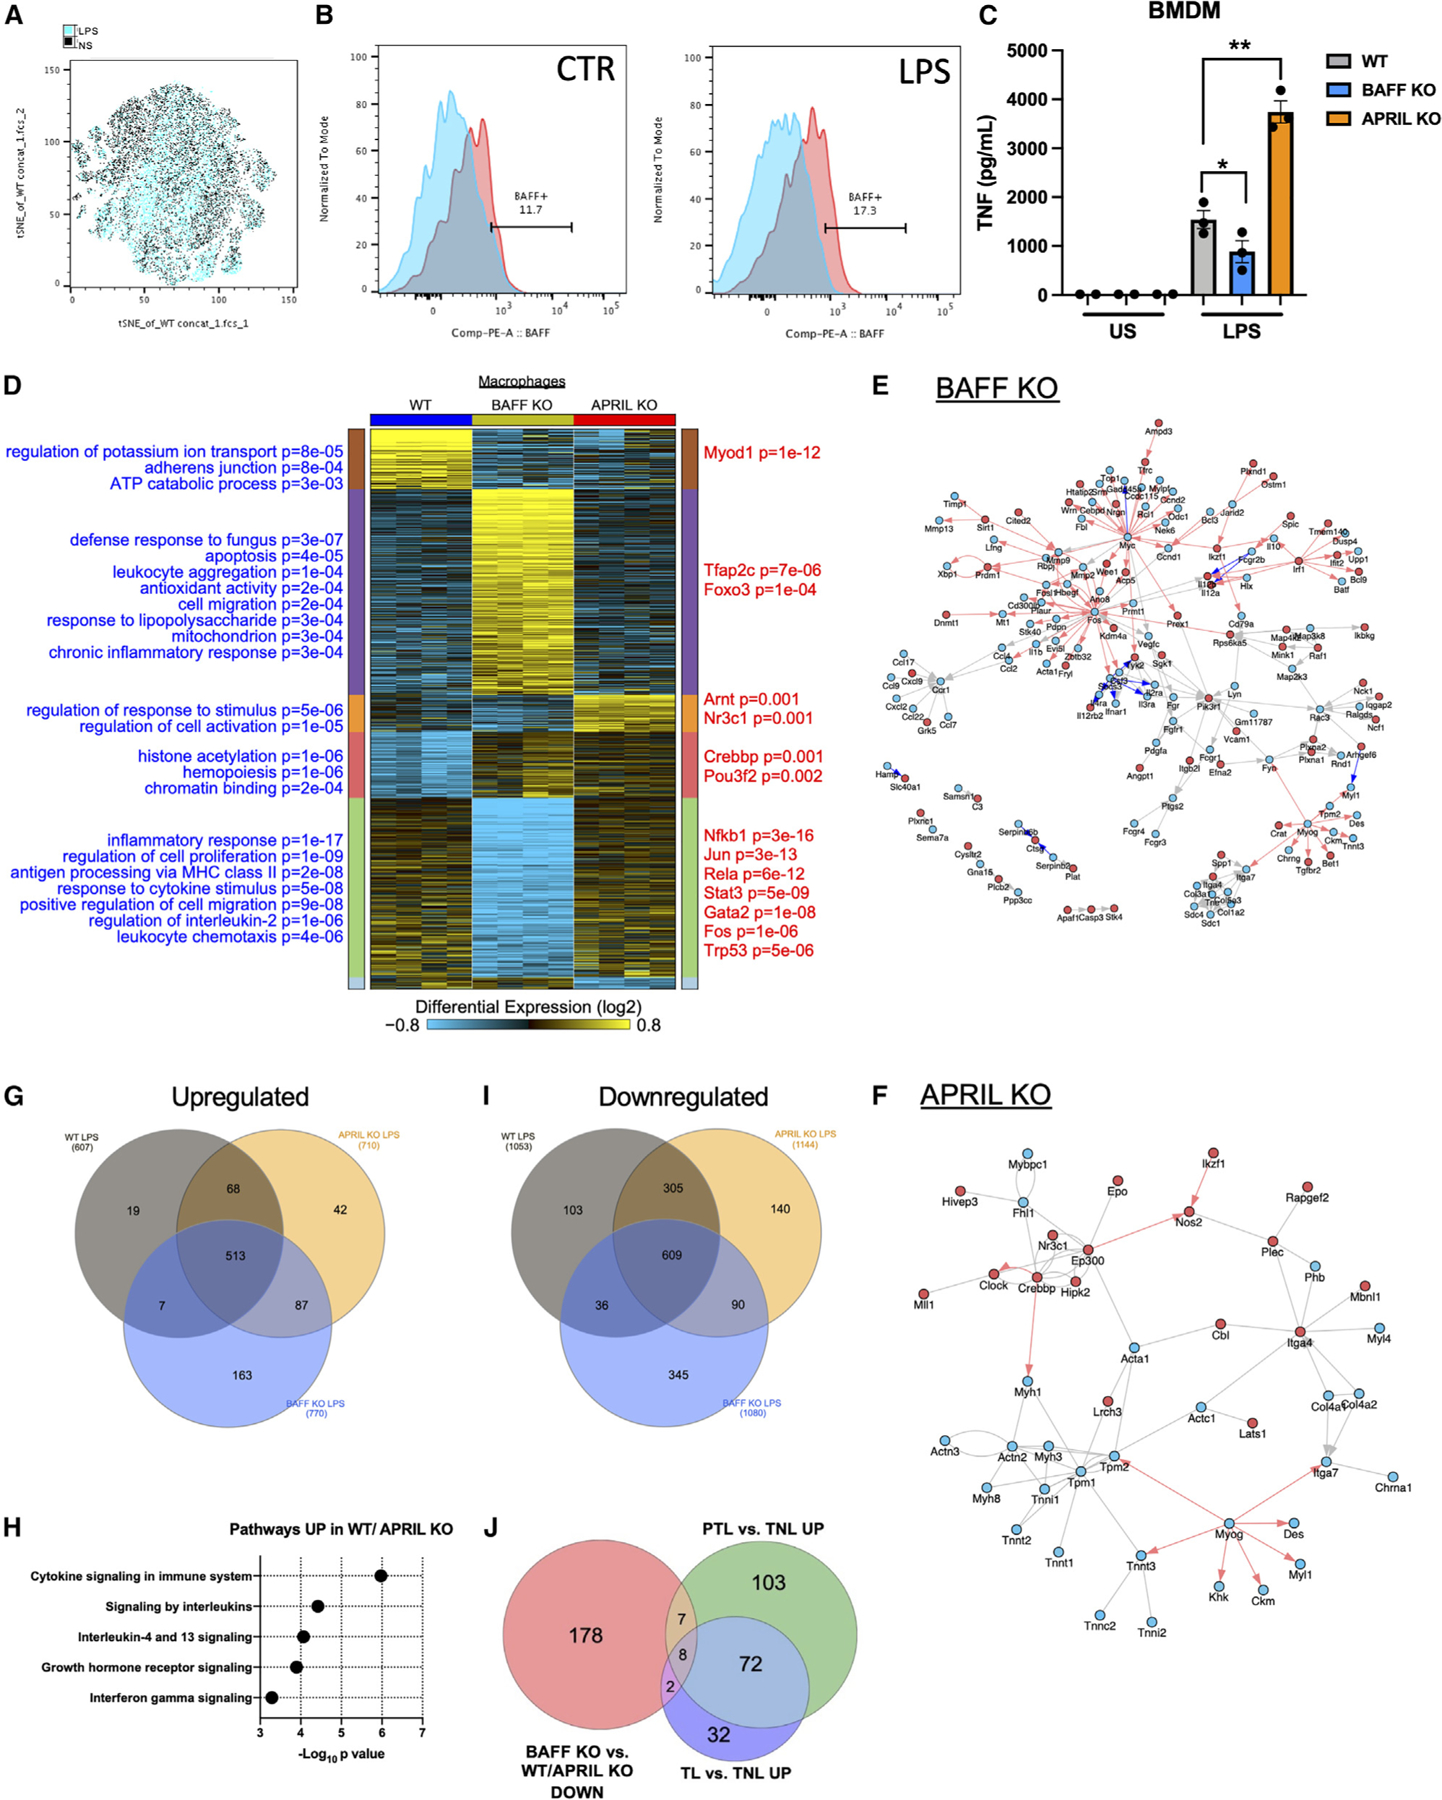
(A) t-distributed stochastic neighbor embedding (tSNE) analysis of flow cytometry on WT mouse decidua/myometrium following 6-h LPS challenge (blue) or saline (black) injection (n = 2/condition).
(B) BAFF expression in WT (blue) and BAFF-RFP+ (red) decidua/myometrium macrophage (CD45+F4/80+CD11b+) populations collected 6 h following saline (CTR) or LPS challenge.
(C) Supernatant TNF production from WT, BAFF-deficient, and APRIL-deficient mouse BMDMs, unstimulated (US) or stimulated with 10 ng LPS for 4 h.
(D) Heatmap of differentially expressed genes (FDR significant), organized by their predominant expression patterns (MarkerFinder algorithm in AltAnalyze) in WT, BAFF-deficient, and APRIL-deficient macrophages following LPS stimulation. Statistically enriched Gene Ontology (GO) terms are shown on the left of each associated cluster and putative transcriptional regulators derived from PAZAR annotated transcriptional targets on the right, from the software GO elite.
(E and F) Predicted interaction network of differentially expressed genes (up- or downregulated >1.5-fold) in (E) BAFF KO or (F) APRIL KO, with a moderated t test p < 0.05 (FDR corrected) in the NetPerspective module of AltAnalyze. Red arrows indicate putative transcriptional target genes from PAZAR or Amadeus, red nodes indicate upregulation, and blue nodes indicate downregulation. Blue arrows indicate inhibitory interactions.
(G) Venn diagram depicting overlap of upregulated genes (>1.5-fold) following LPS challenge of WT, APRIL-deficient, and BAFF-deficient macrophages.
(H) Top enriched biological pathways (ToppFun) from 68 genes upregulated in both WT and APRIL-deficient macrophages.
(I) Venn diagram depicting overlap of genes that were downregulated (>1.5-fold) following LPS challenge of WT, APRIL-deficient, and BAFF-deficient macrophages.
(J) Venn diagram of fold >1.2 and p < 0.05 (FDR) gene expression of macrophages from preterm labor (PTL) versus term no labor (TNL) and term labor (TL), from the study by Pique-Regi et al.39 compared with genes that were <1.5-fold in BAFF-deficient macrophages versus APRIL-deficient macrophages in the mouse.
(C) One-way ANOVA with Tukey’s multiple comparison test. *p < 0.05, **p < 0.01, ****p < 0.0001.