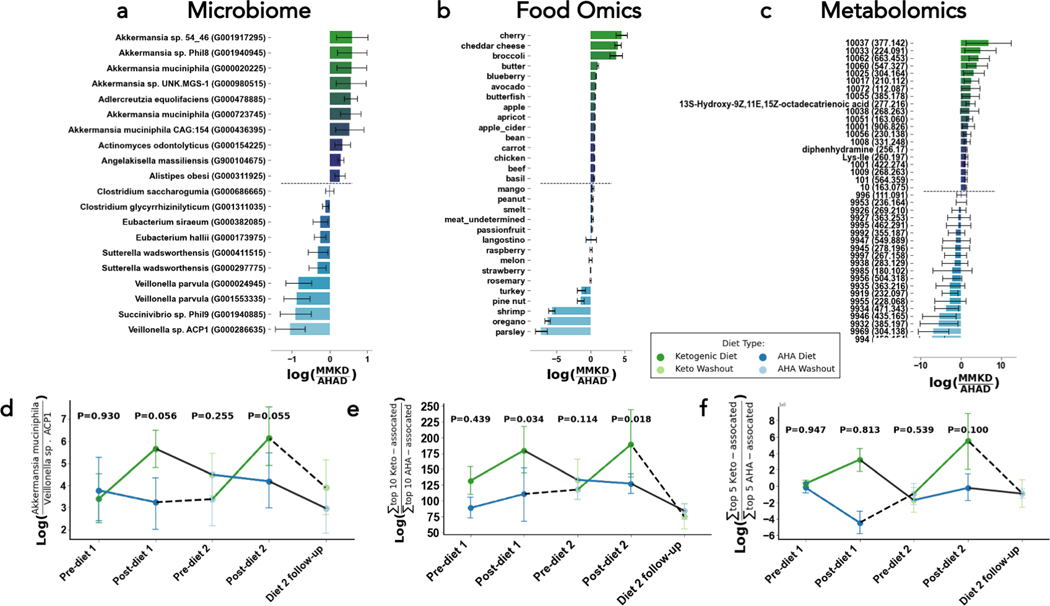
Figure 3. Microbial strains (left), foods (middle), and metabolites (right) related to diet type, but not necessarily cognitive status.
The differential abundances for the top 10 and bottom 10 with mean (bar) and model 95% confidence interval (error bars) associated with cognitive Ketogenic (more positive, green) and low-fat / american heart association diets (more negative, blue) (A, B, C). The log-ratio (y-axis) of the top and bottom bacterial strains (D), and sum of the top and bottom 10 foods (E) or metabolites (F) plotted across time (x-axis) and colored by diet. Presented diet stage p-values in log-ratio plots are determined from linear mixed effects models with fixed effects of diet, cognitive status, period, and diet sequences with random effect of subject.

