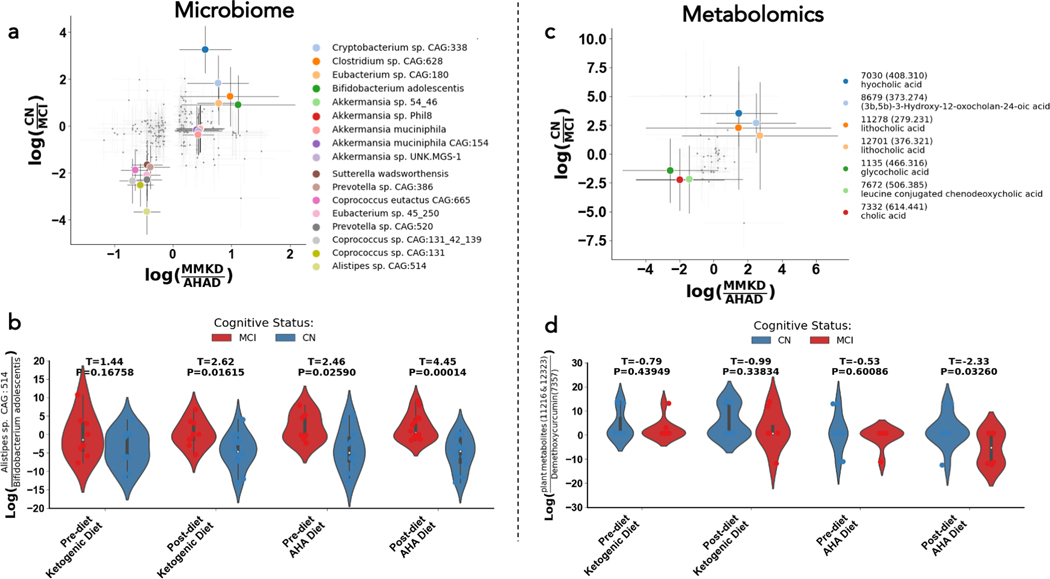
Figure 4. Microbial strains (left), foods (middle), and metabolites (right) related to both cognitive status and diet.
Scatter plot of log ratios of differential abundances by diet (x-axes) and cognitive status (y-axes) for microbes, with the ten most differential microbes and metabolites in both axes colored (A). Violin plot of the log-ratio of Alistepes sp. CAG: 514 to Bifidobacterium adolescentis at four different timepoints in the study (B). Scatter plot of log ratios of differential abundances by diet (x-axes) and cognitive status (y-axes) for microbes, with the ten most differential microbes and metabolites in both axes colored (C). Violin plot of the log-ratio of plant metabolites to Diarylheptanoids at four different timepoints in the study (D). In the scatterplots shown in (A) and (C), each corner corresponds to a different subpopulation: the top right corner represents microbes/metabolites associated with the MMKD and CN, the top left corner contains the microbes/metabolites correlated with the AHAD and CN, the bottom left corner shows microbes/metabolites associated with the AHAD and mild cognitive impairment, and the bottom right corner corresponds to microbes/metabolites correlated with the MMKD and MCI. These analyses allowed us to examine microbial and metabolite changes that were modulated by both diet and cognitive status.

