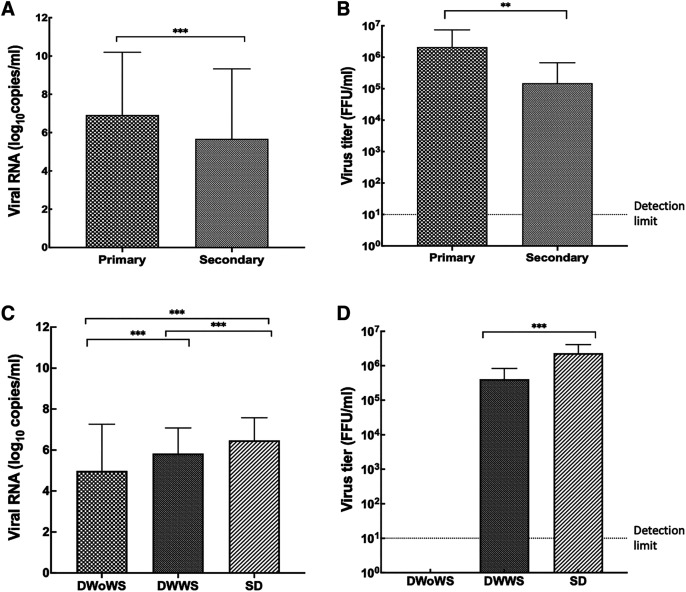
Figure 3.
Viremia levels in different types of infection and in different severity groups. (A) Mean viral genome (copies/mL) levels in different types of infection. (B) Mean infectivity titer (FFU/mL) in different types of infection. (C) Mean viral genome (copies/mL) levels in different severity groups. (D) Mean infectivity titer (FFU/mL) in different severity groups. Kruskal–Wallis one-way analysis of variance was performed among groups. Continuous variables were compared using the Mann–Whitney U test between two groups (**P > 0.01; ***P < 0.001). Error bars describe standard deviation of the mean. DWoWS = dengue without warning signs; DWWS = dengue with warning signs; FFU = focus-forming units; SD = severe dengue.

