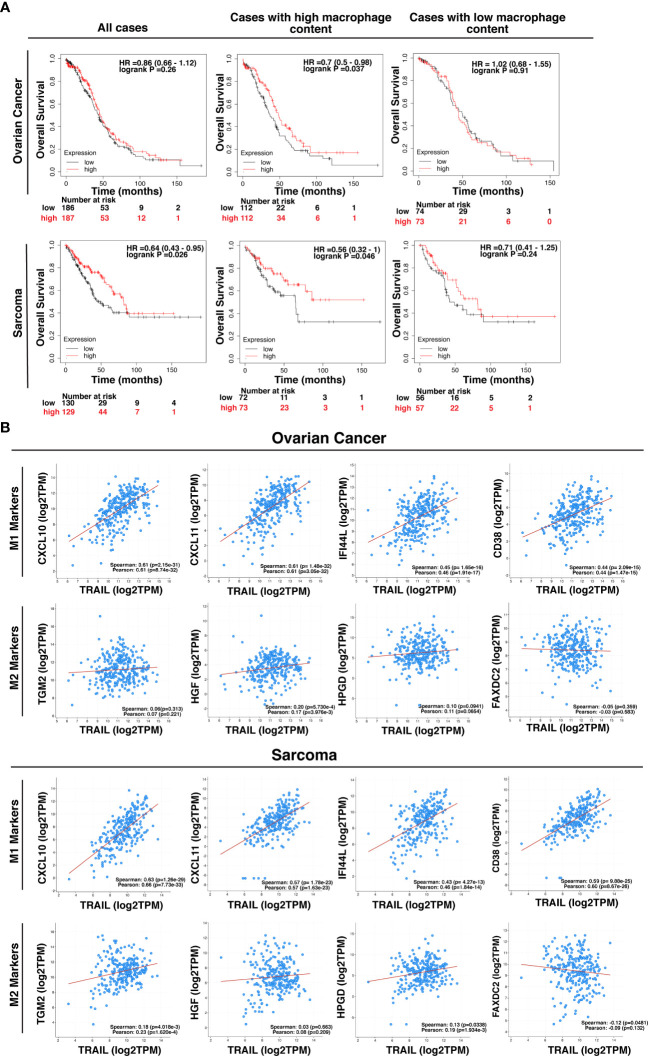
Figure 13.
High-level expression of TRAIL in ovarian and sarcoma cancer patients is positively correlated with M1 gene signature and increased survival in cases with high tumor macrophage content. (A) Kaplan-Meier plots showing the overall survival of ovarian and sarcoma cancer patients based on TRAIL gene (TNFSF10) expression. Patients were classified as either high (red line) or low (black line) TRAIL expression based on the median cut-off value. Hazard ratio (HR), p-value, and confidence interval (CI) for each group were determined using log-rank test. (B) Scatter plots showing the correlation between the expression of TRAIL and M1 markers (CXCL10, CXCL11, IFI44L, and CD38) or M2 markers (TGM2, HGF, HPGD, and FAXDC2) in ovarian and sarcoma cancer patients. Spearman’s rank and Pearson correlation coefficient and p-values were also shown. A positive correlation (R>0) indicates that higher expression of TRAIL is associated with higher expression of the M1 markers at the gene level. The plots were generated by using KM plotter and cBioPortal tools.

