
Figure 9.
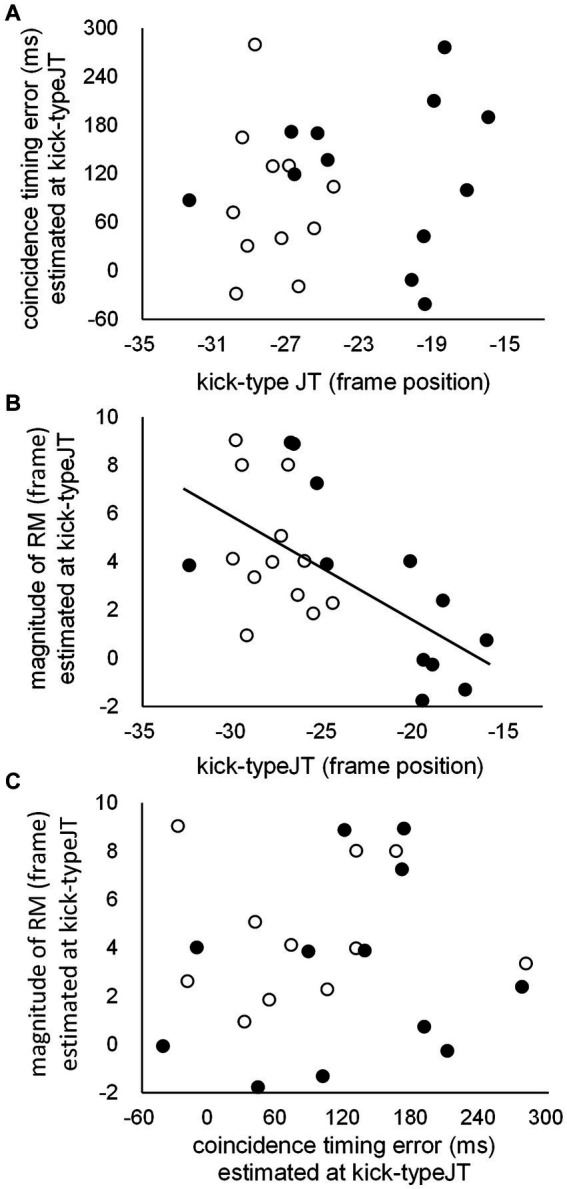
Scattergrams for individual task scores between (A) kick-typeJTs and CT errors estimated at kick-typeJT, (B) kick-typeJTs and the magnitudes of RM estimated at kick-typeJT, and (C) CT errors and the magnitudes of RM estimated at kick-typeJT for club members (unfilled dots) and non-members (filled dots). The regression line depicted in (B) indicates that the correlation coefficient is significant.