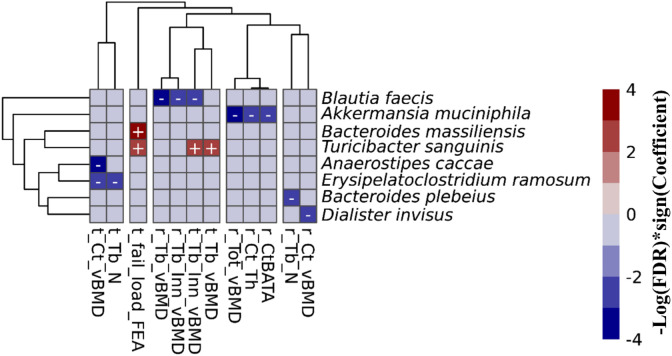
Figure 4.
Associations between the gut microbial species and bone measures in the FHS cohort. This includes all of the 15 associations with an FDR ≤ 0.1 that were calculated using MaAsLin2. We adjusted for all covariates in the association models. The X and Y axes were clustered hierarchically. The “+” and “-“ signs indicate the direction of association between microbial abundance on the vertical axis and bone measures along the horizontal axis.

