
Figure 1.
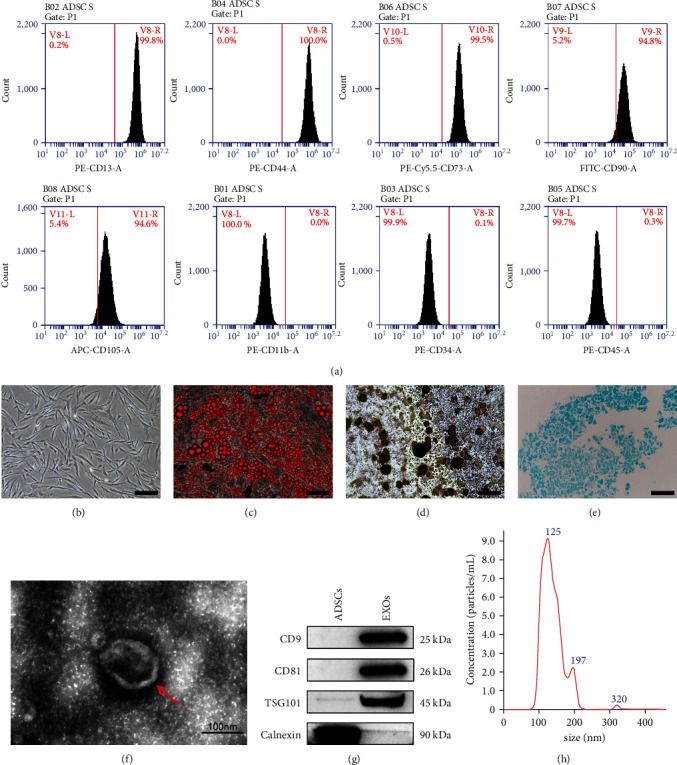
Identification of ADSCs and ADSC-Exos. (a) Detection of surface markers of ADSCs by flow cytometry. (b) Cell morphology of human adipose stem cells, scale bar: 200 μm. (c) Lipogenic differentiation (Oil Red O staining), scale bar: 100 μm. (d) Osteogenic differentiation (alizarin red staining), scale bar: 100 μm. (e) Chondrogenic differentiation (alcian blue staining), scale bar: 100 μm. (f) Morphology of ADSC-Exos observed by transmission electron microscopy, scale bar: 100 nm. (g) Detection of exosome surface markers by western blot. (h) ADSC-Exos particle size distribution by NTA.