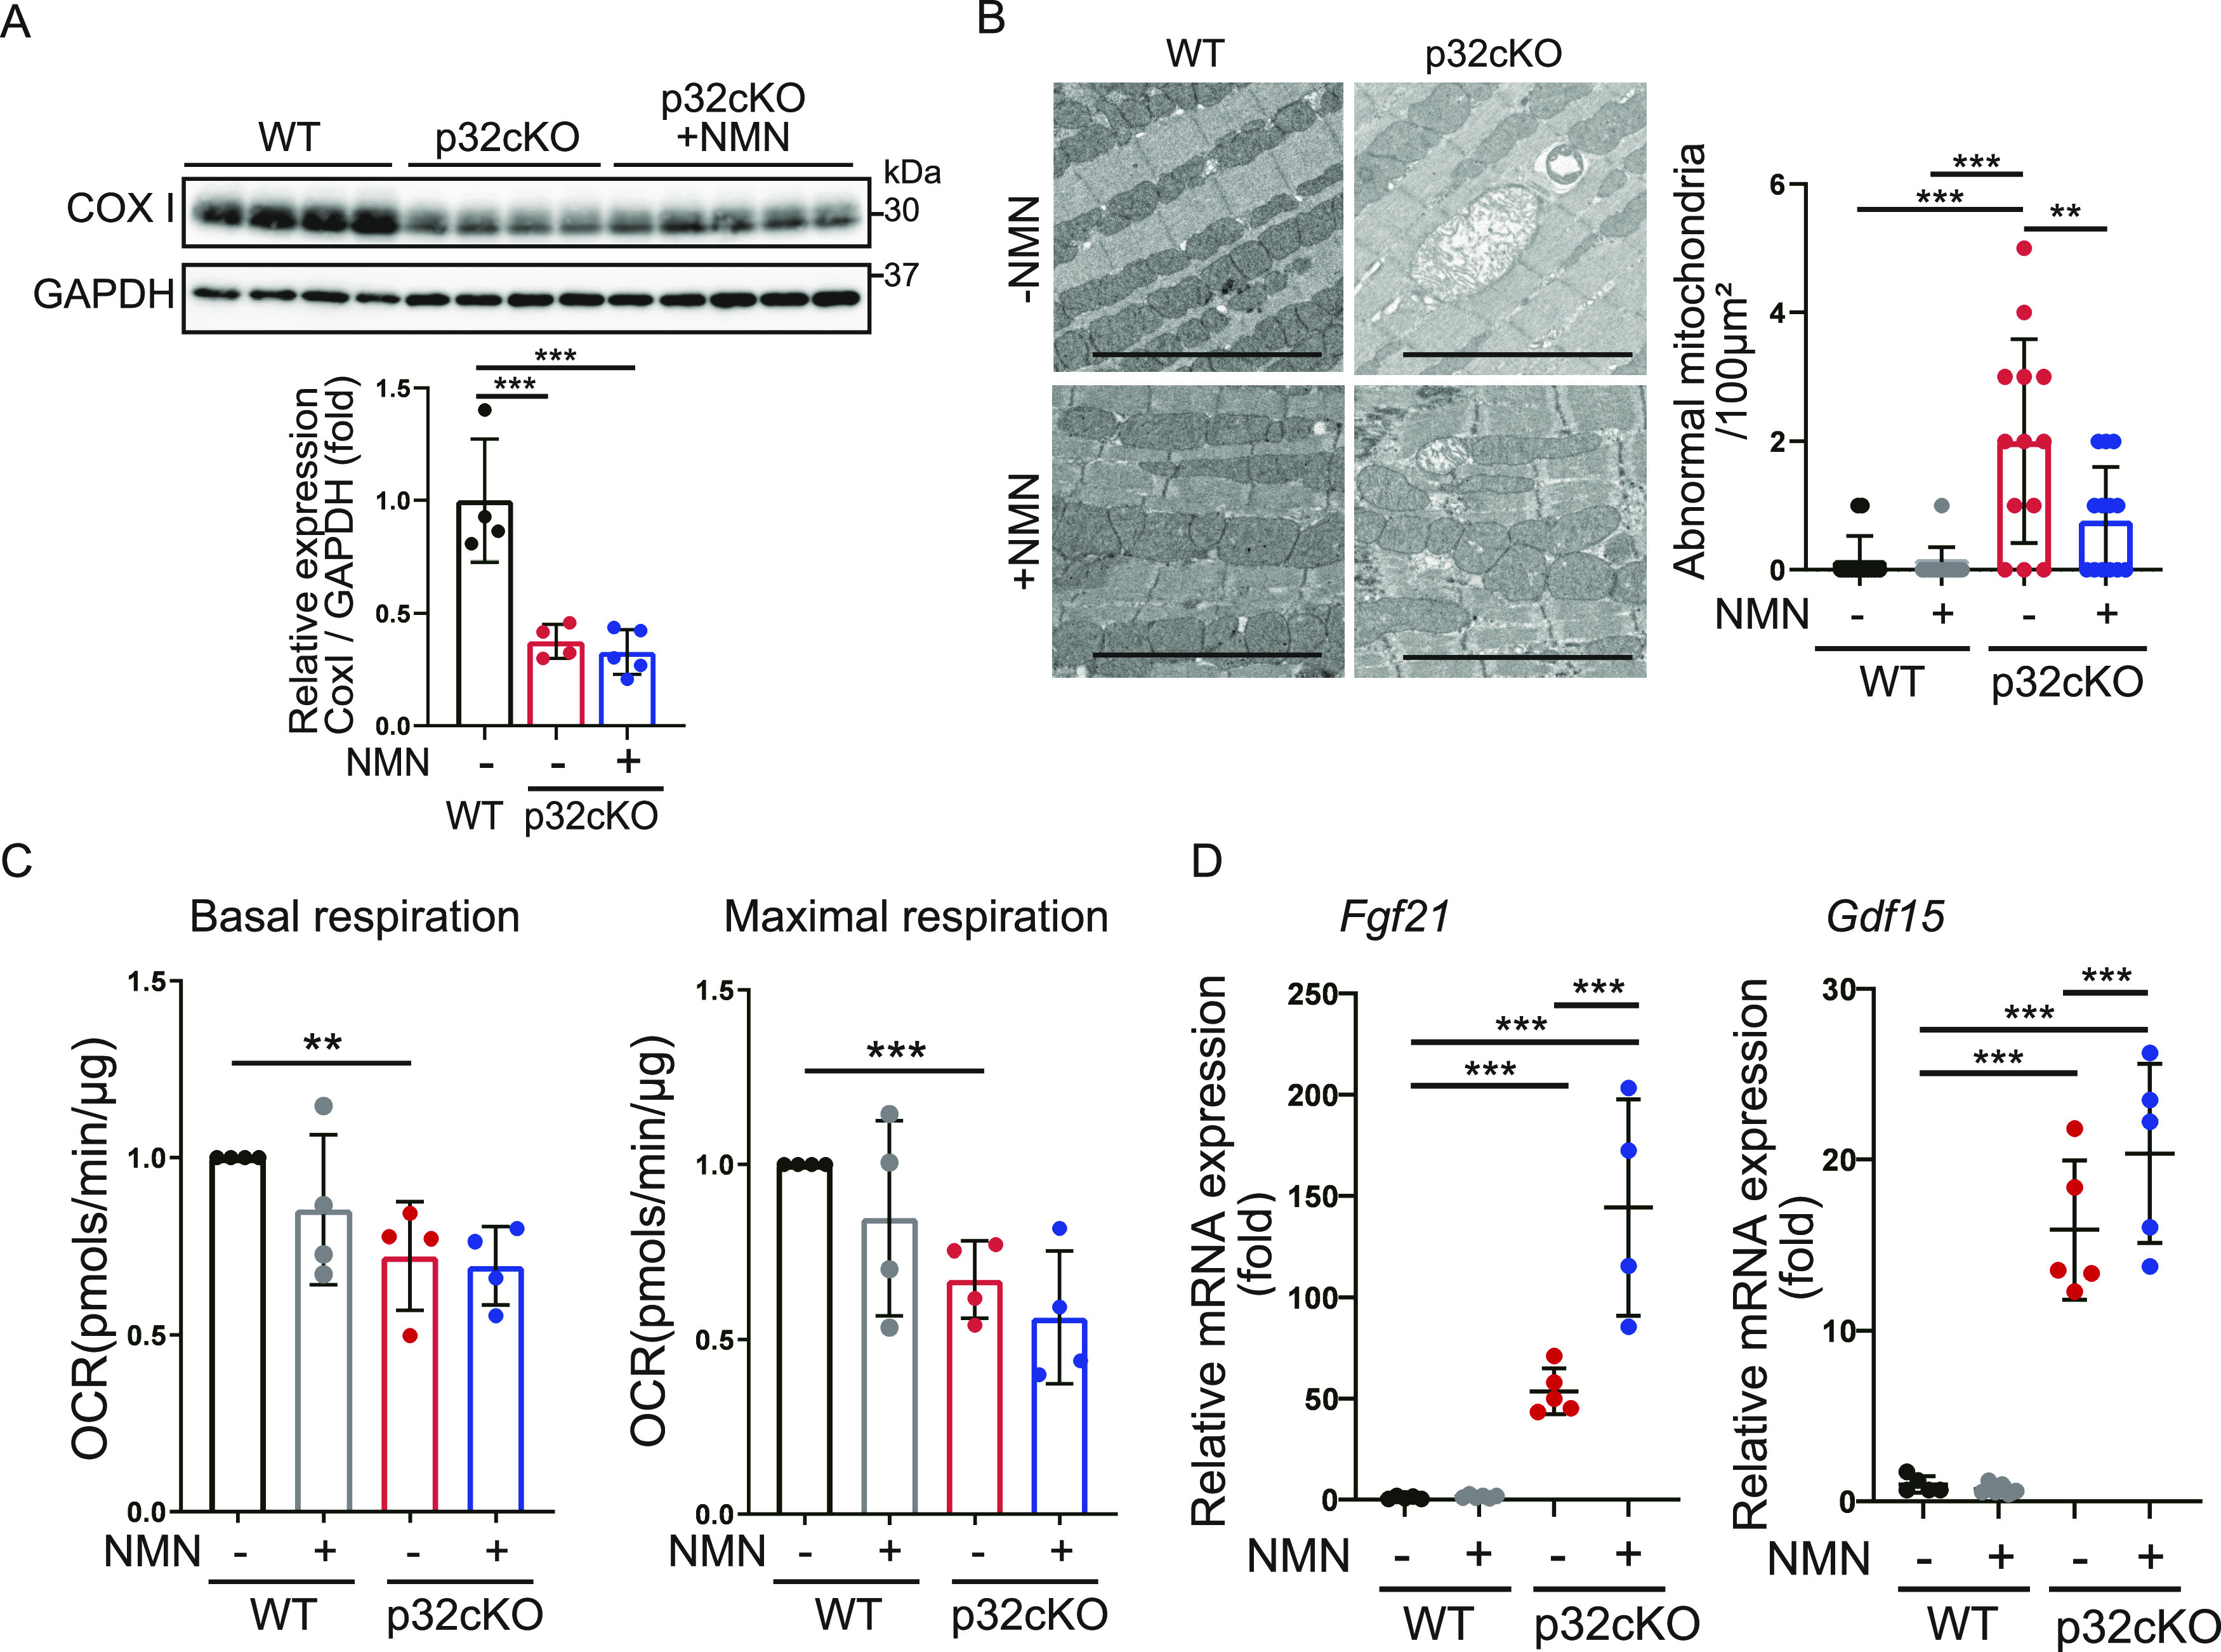
Figure 5. Mitochondrial dysfunction is not rescued by nicotinamide mononucleotide (NMN) administration.
(A) Western blot analysis of the mitochondrial DNA-encoded protein CoxI in 9-mo-old WT and p32cKO mice, and in p32cKO mice treated with NMN from 2 to 9 mo of age. GAPDH was used as an internal control. Quantification is shown in a graph. Values are presented as the mean ± SD (WT and p32cKO: n = 4, p32cKO + NMN: n = 5). (B) Mitochondrial morphology in the hearts of 9-mo-old WT and p32cKO mice, and of WT and p32cKO mice treated with NMN from 2 to 9 mo of age observed by electron microscopy. Scale bars, 5 μm. Quantification of the average area of abnormal mitochondria is shown in a graph, and data are shown as the mean ± SD (n = 3). (C) The oxygen consumption rate in heart mitochondria was analyzed with the flux analyzer. Basal respiration and maximal respiration were calculated as respiratory parameters. WT and p32cKO mice were treated with or without NMN from 2 to 9 mo of age. Values are presented as the mean ± SD (n = 4). (D) Real-time polymerase chain reaction analysis of mRNA expression in the heart of WT and p32cKO mice treated with NMN from 2 to 9 mo of age. The mitochondrial disease biomarkers Fgf21 (fibroblast growth factor 21) and Gdf15 (growth and differentiation factor 15) are shown. Data are presented as the mean ± SD (n = 5). Data were analyzed by one-way analysis of variance with Tukey’s multiple comparisons test. *P < 0.05, **P < 0.01, ***P < 0.001.
Source data are available for this figure.