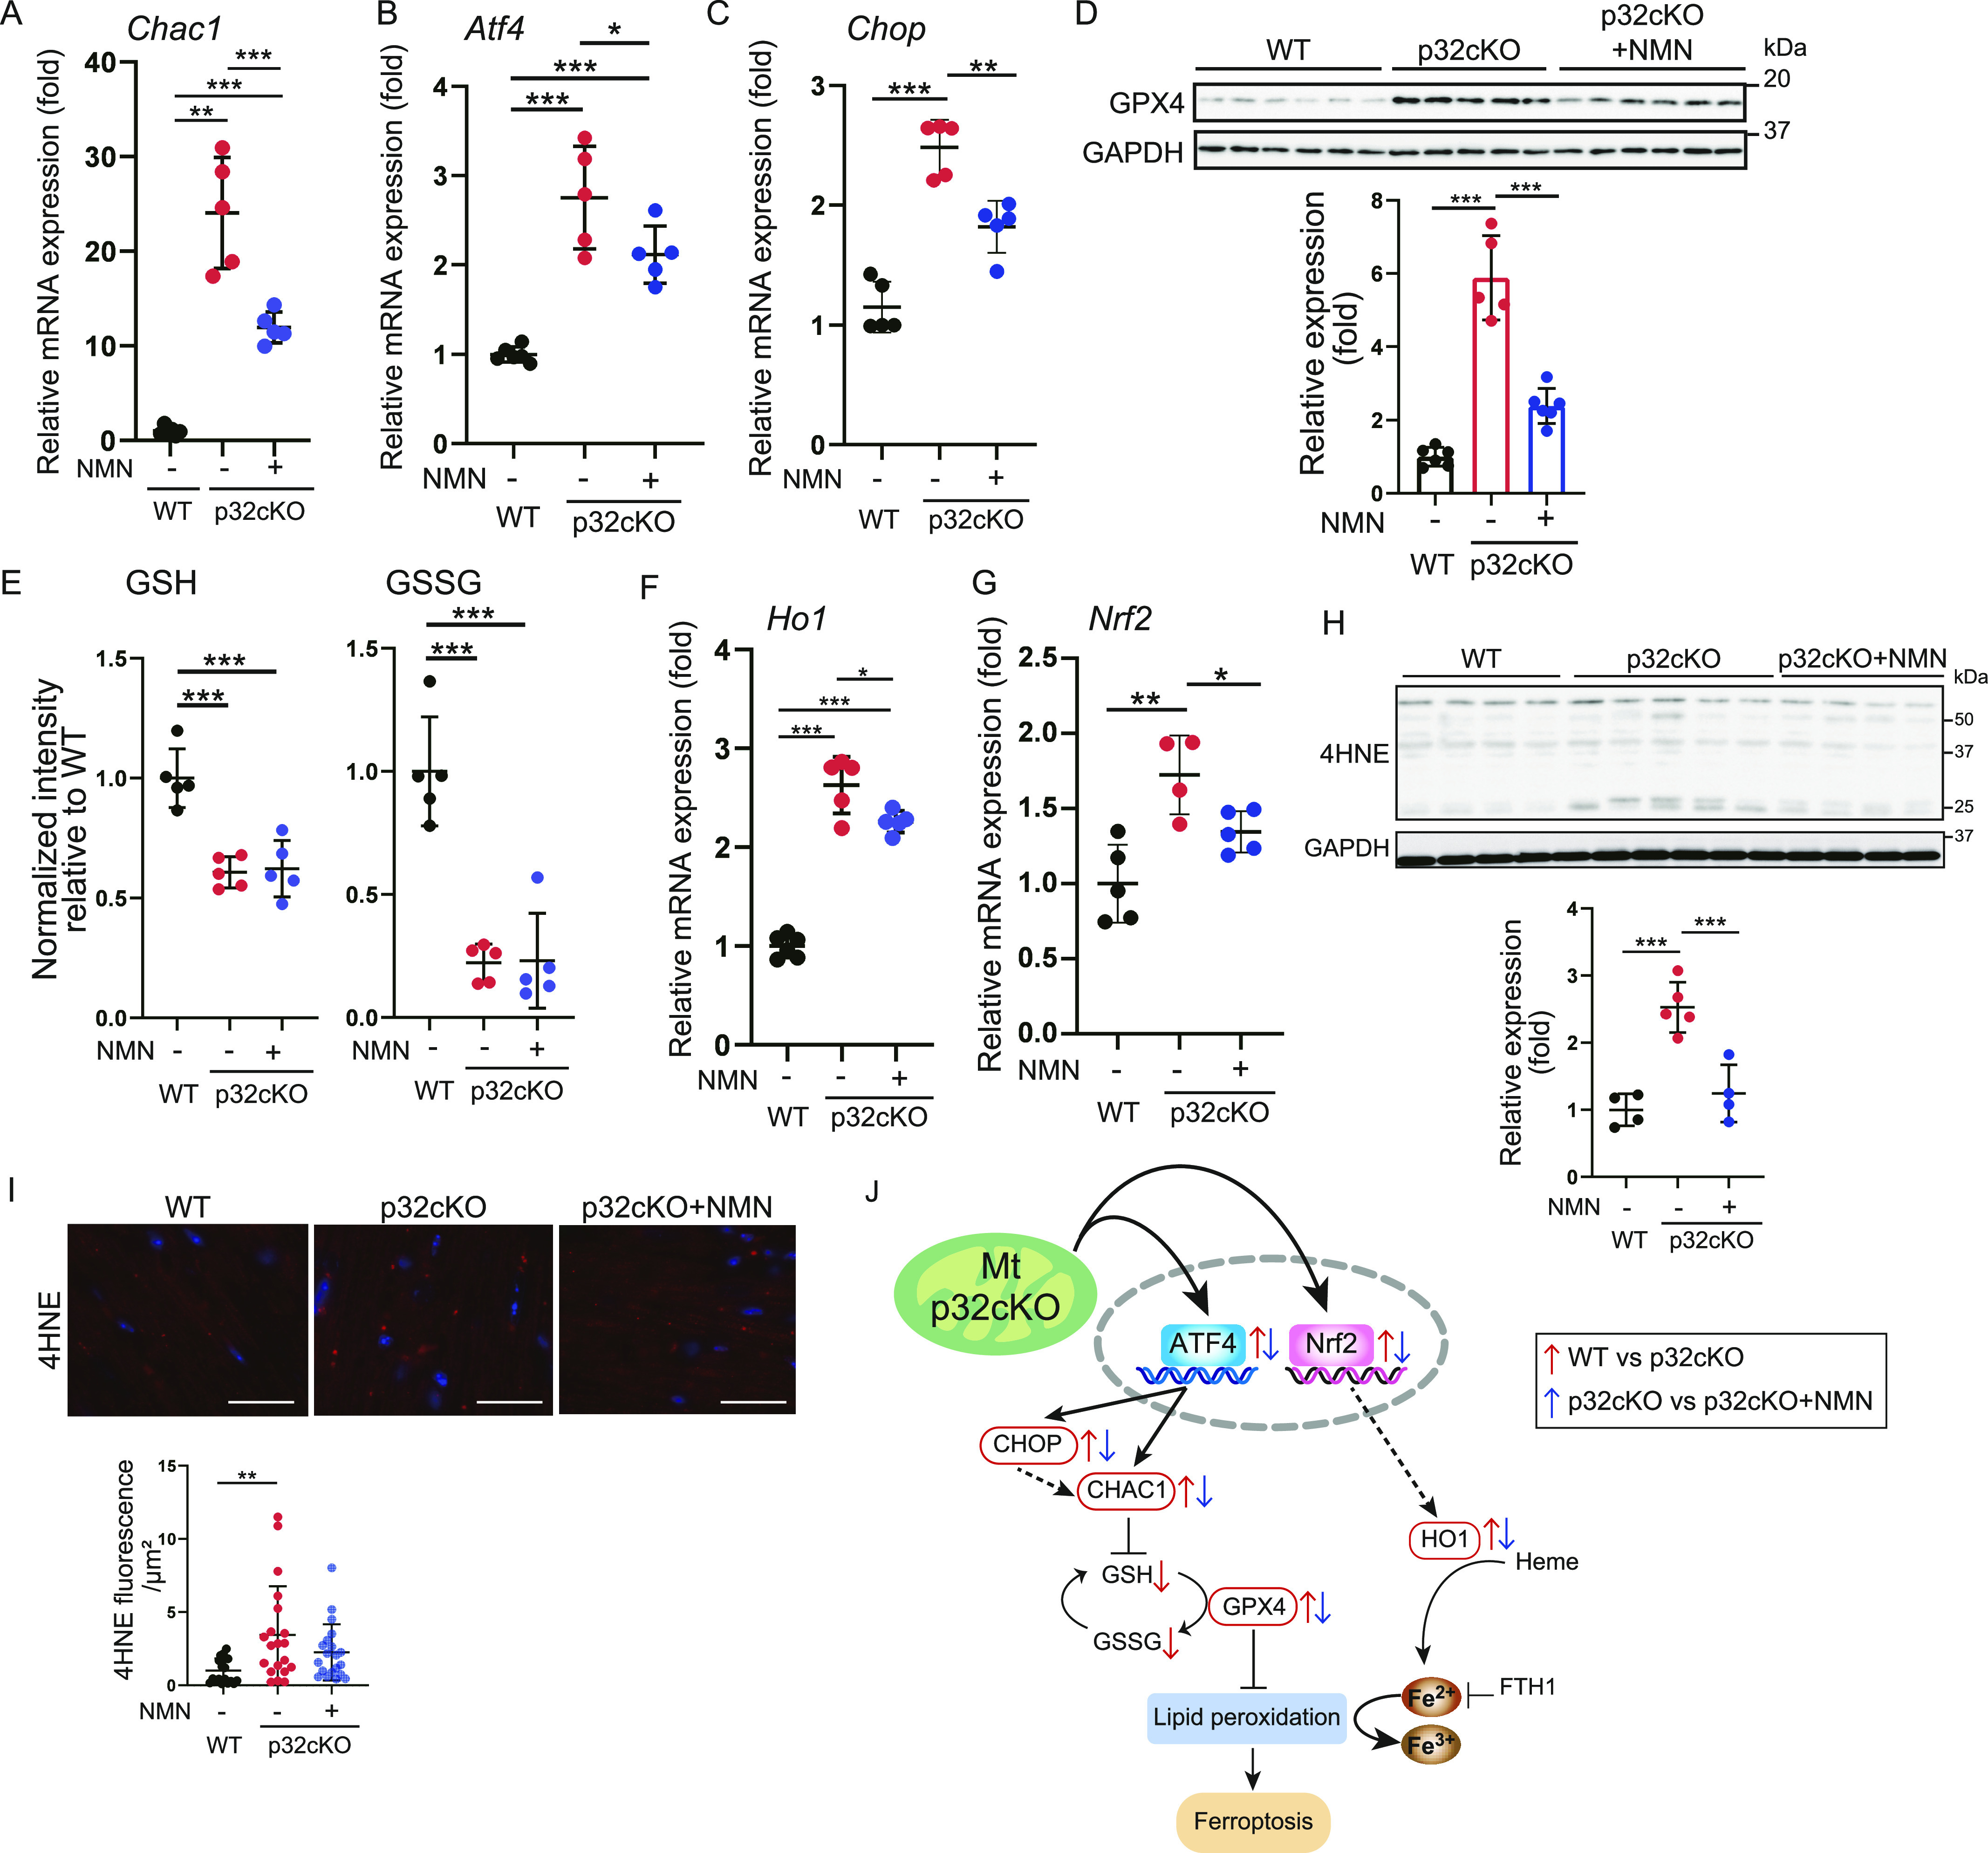
Figure 6. Mitochondrial translation deficiency induces ferroptosis.
(A, B, C) Real-time polymerase chain reaction analysis of RNA expression in the heart of WT and p32cKO mice treated with nicotinamide mononucleotide (NMN) from 2 to 11 mo of age (WT, p32cKO, and p32cKO + NMN: n = 5). Chac1 was used as a marker of ferroptosis and an ATF4 inducer. Atf4 and Chop were used as markers of mitochondrial stress. Data are presented as the mean ± SD. (D) Western blot analysis of the ferroptosis-related protein glutathione peroxidase 4 in the heart of 11-mo-old WT and p32cKO mice, and of p32cKO mice treated with NMN from 2 to 11 mo of age (WT and p32cKO + NMN: n = 6, p32cKO: n = 5). GAPDH was used as an internal control. Quantification is shown in a graph. Values are presented as the mean ± SD. (E) LC-MS/MS metabolomic analysis of GSH and GSSG in 9-mo-old WT and p32cKO mice, and in mice treated with NMN from 2 to 9 mo of age (WT, p32cKO, and p32cKO + NMN: n = 5). Data are presented as the mean ± SEM. (F, G) Real-time polymerase chain reaction analysis of mRNA expression in the heart of WT and p32cKO mice treated with NMN from 2 to 11 mo of age (WT, p32cKO, and p32cKO + NMN: n = 5). Data are presented as the mean ± SD. (H) Western blot analysis of lipid peroxidation (shown by 4-HNE) to assess various ferroptosis markers in the heart of 11-mo-old WT and p32cKO mice and of p32cKO mice treated with NMN from 2 to 11 mo of age (WT and p32cKO + NMN: n = 4, p32cKO: n = 5). GAPDH was used as an internal control. Quantification is shown in a graph. Values are presented as the mean ± SD. (I) Immunostaining of 4-HNE (red) and DAPI (blue) in the heart tissue of WT and p32cKO mice and of p32cKO mice treated with NMN from 2 to 11 mo. The right panel shows the level of 4-HNE overlap per cell corrected with DAPI (n = 4). Data are presented as the mean ± SD. Scale bars, 20 μm. (A, B, C, D, E, F, G, H, I) Data were analyzed by one-way analysis of variance with Tukey’s multiple comparisons test. *P < 0.05, **P < 0.01, ***P < 0.001. (J) The ferroptosis pathway is changed in the p32cKO heart. Red arrows indicate an increase or decrease in the p32cKO heart compared with the level in the WT heart. Blue arrows indicate the comparison between p32cKO and p32cKO + NMN. Red squares indicate genes of which expression was restored by the addition of NMN.
Source data are available for this figure.

