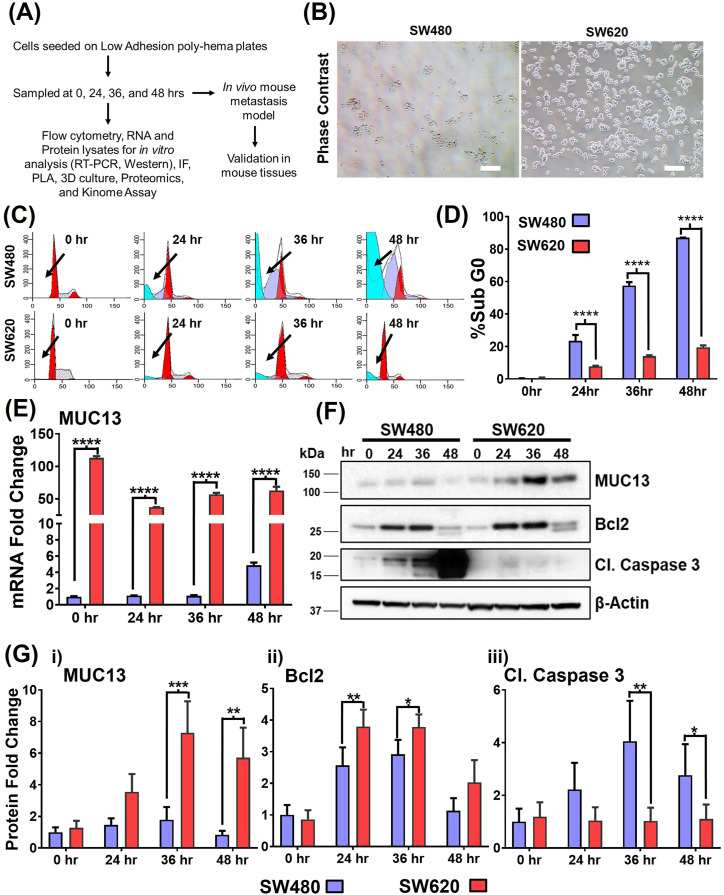
Figure 1. Higher MUC13 expression is associated with better anchorage-independent survival in isogenic cancer cells.
(A) Outline of the model and strategy adopted for the proposed study. (B) Survival of two isogenic CRC cells with high (SW620) and low (SW480) MUC13 expression after anchorage-independent stimulation. Cells plated on low adhesion (poly-HEMA-coated) culture dishes for 36 h were collected and re-plated on regular culture dishes and photographed under a phase contrast microscope after 8 h (Scale bar, 20 μm). (C, D) Cell cycle analysis of SW480 and SW620 at 0, 24, 36, and 48 h after anchorage-independent cell survival or anoikis stimulation. (C) The histogram represents the cell cycle distribution, and the arrows indicate the location of the Sub G0 population of SW480 and SW620 cells. Quantification (D) of % Sub G0 population of SW480 and SW620 cells at different time points. Unpaired t test, n = 3. Data are represented as mean ± SEM. *P < 0.05, **P < 0.01, and ***P < 0.001 denotes significant differences among tested cells. (E, F, G) Cells (SW480 and SW620) were subjected to anchorage-independent stimulation for different time points (0, 24, 36, and 48 h) and subjected to MUC13 mRNA analysis by qRT–PCR (E) and Western blot analysis (F). Quantification (G) of SW480 and SW620 immunoblots and qRT–PCR at 0, 24, 36, and 48 h after anchorage-independent stimulation. The data are shown as mean ± SEM in all panels. Sidak’s multiple comparison tests are used after a two-way ANOVA. *P < 0.05, **P < 0.01, ***P < 0.001, and ****P < 0.0001 denote significant differences. Data are representative of at least three individual experiments.

