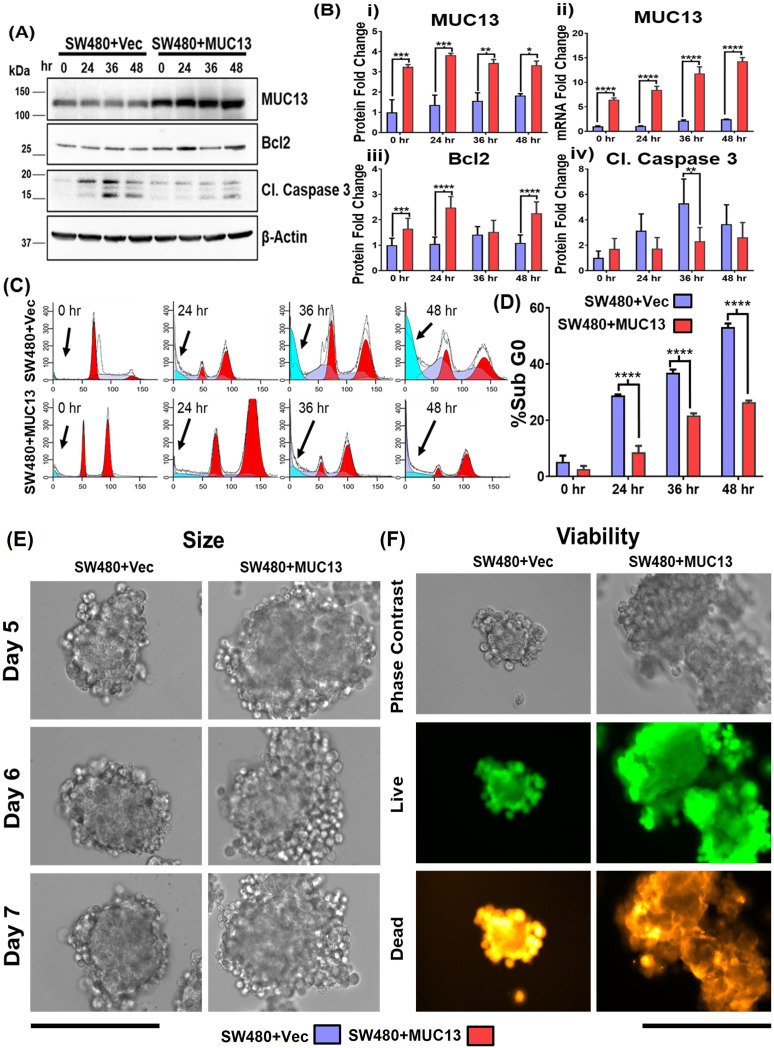
Figure 2. Ectopic MUC13 expression enhances anchorage-independent survival of cancer cells.
(A, B) Western blot analysis of MUC13 overexpressing (SW480+MUC13) and control (SW480+Vec) cell lines at the indicated time points after anchorage-independent stimulation. Quantification (B) of the immunoblots for indicated proteins and qRT–PCR analysis of MUC13 at different anoikis-induction time points. The data are represented as mean ± SEM. Sidak’s multiple comparison tests are used after a two-way ANOVA. **P < 0.01, ***P < 0.001, and ****P < 0.0001 denote significant differences. (C, D) Cell cycle analysis of SW480+Vector and SW480+MUC13 cells at 0, 24, 36, and 48 h after anchorage-independent stimulation. Histogram represents the cell cycle distribution, and arrows indicate the location of the Sub G0 population (C), Quantification (D) of the % Sub G0 population of SW480+Vector and SW480+MUC13 at different time points. Data are represented as mean ± SEM. Sidak’s multiple comparison tests are used after a two-way ANOVA. *P < 0.05, **P < 0.01, ***P < 0.001, and ****P < 0.0001 denote significant differences. (E) Representative phase contrast images of spheroids generated from SW480+Vector and SW480+MUC13 after anchorage-independent stimulation (scale bar, 100 μm). (F) Cell viability analysis shows representative phase contrast and fluorescence images of live (green) and dead (red) stains (scale bar, 100 μm).

