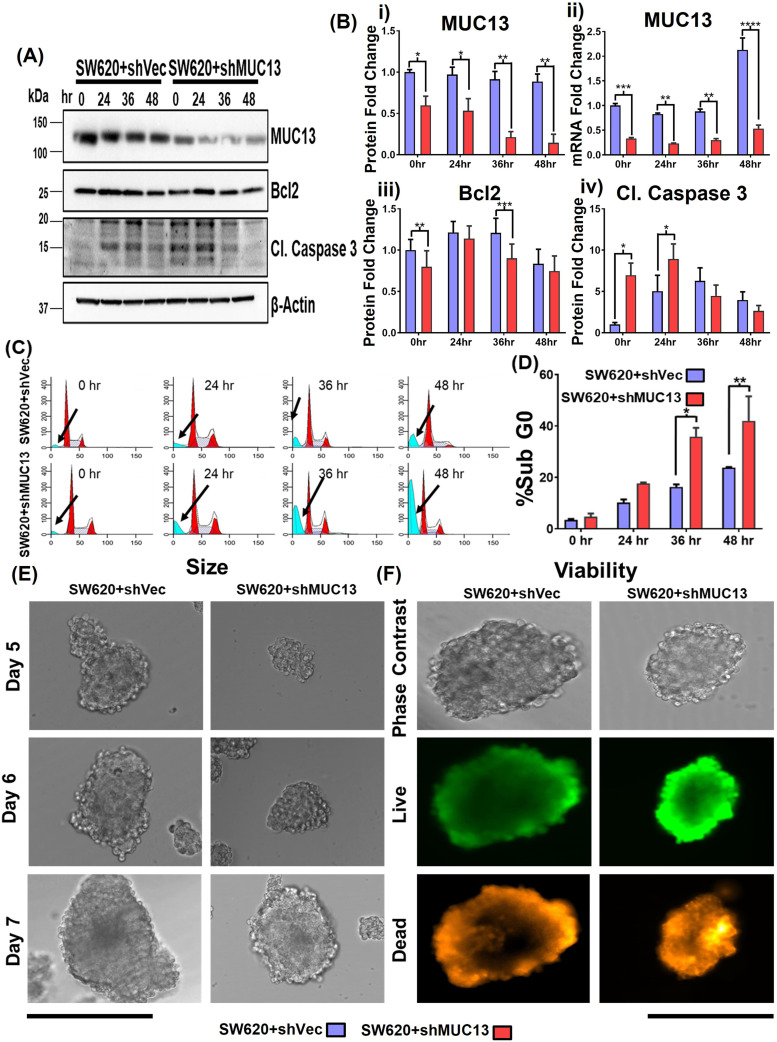
Figure 3. MUC13 knockdown decreases anchorage-independent survival of cancer cells.
(A) Western blot analysis of MUC13 knockdown (SW620+shMUC13) and its respective control (SW620+shVec) cell lines after anchorage-independent stimulation. (B) Quantification of immunoblots at indicated time points after anchorage-independent stimulation and qRT–PCR analysis of MUC13 at different anoikis-induction time points. Data are represented as mean ± SEM. Two-way ANOVA followed by Sidak’s multiple comparison test. (C, D) Cell cycle analysis (C) and quantification (D) of Sub G0 population of cells at different time points after anchorage-independent stimulation. All panels: The data are representative of at least three individual experiments. The data are shown as mean ± SEM. Sidak’s multiple comparison test is used after a two-way ANOVA. *P < 0.05, **P < 0.01, ***P < 0.001, and ****P < 0.0001 denote significance. (E) Representative phase contrast images of spheroid generated from MUC13 knockdown (SW620+shMUC13) and control (SW620+shVector) cells after anchorage-independent stimulation (Scale bar, 100 μm). (F) Representative phase contrast and fluorescence images of cell viability in spheroids and quantification of live (green)/dead (red) cells at day 7 after anchorage-independent stimulation (scale bar, 100 μm).

