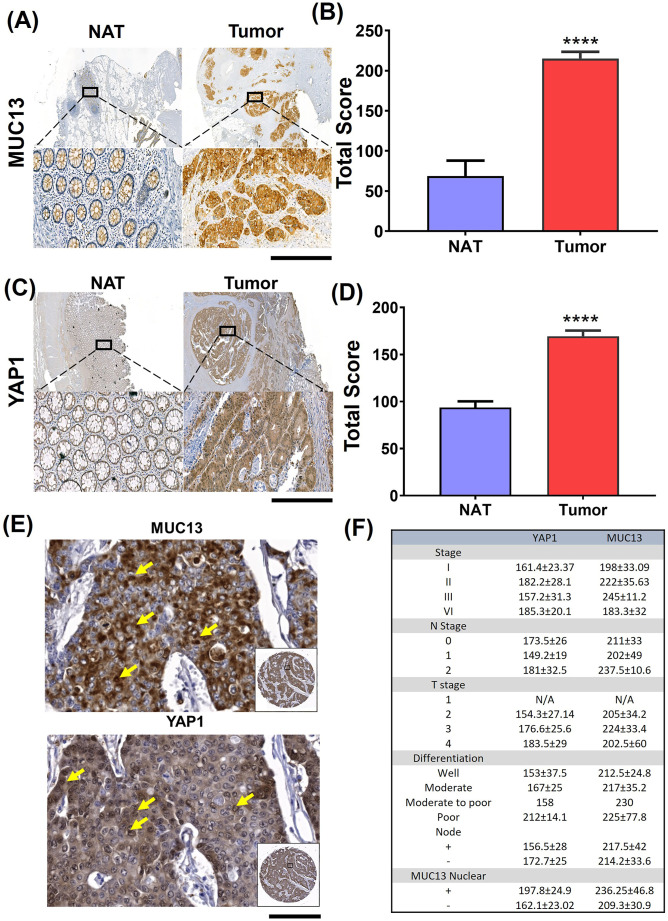
Figure 7. MUC13 and YAP1 expression positively correlate in human CRC tissue.
(A, B) MUC13 IHC staining profile in NAT tissues compared with the tumor (scale bar, 50 μm) and quantitation of their respective staining scores. (A, B, C, D) YAP1 IHC staining profile in NAT tissues as compared with the tumor (scale bar, 50 μm) and quantitation of their respective staining score (A, B) IHC staining of MUC13 and YAP1 in different stages of human CRC tissues and (C, D) the quantitation of their total score. Unpaired t test. The data are shown as mean ± S.D. *P < 0.05, **P < 0.01, and ***P < 0.001 denote significant differences. (E) Nuclear staining of MUC13 and YAP1 in human CRC tissues of the same patients (scale bar, 20 μm). Yellow arrows indicate nuclear staining of MUC13 and YAP1 in the zoomed areas. (F) Clinical characteristics of human CRC tissues along with MUC13 and YAP1 staining. The average score of MUC13 and YAP1 staining in human CRC tissue samples was broken down by the stage, the N and T stage, the differentiation of the tumor, the nodal status of the tumor, and the presence of MUC13 in the nucleus.

