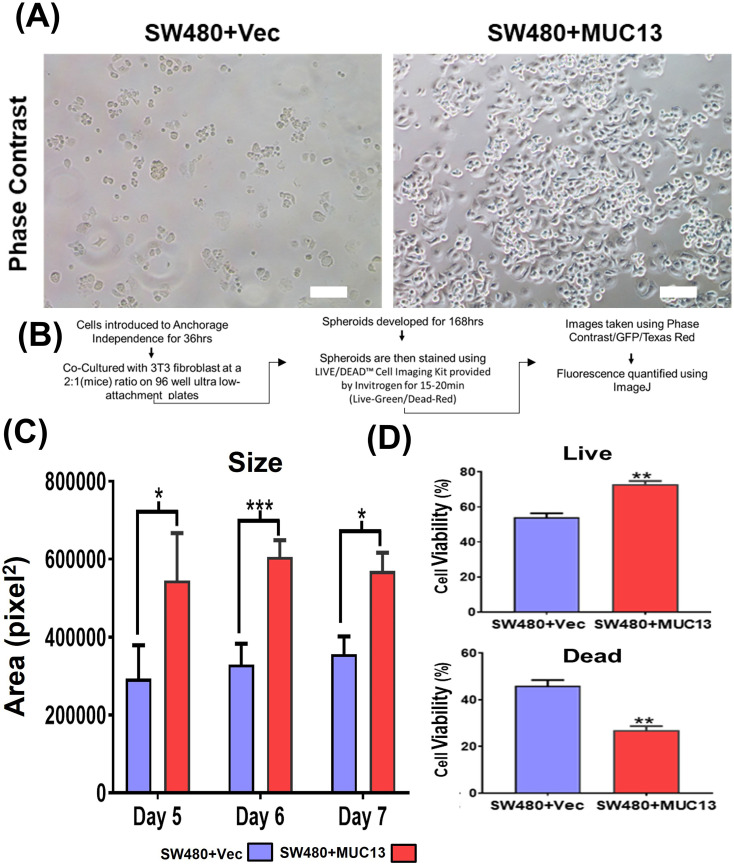
Figure S1. MUC13 expression promotes anchorage-independent survival of cancer cells.
(A) Phase contrast images of MUC13 overexpression cells (SW480+Vec and SW480+MUC13 cells) after anchorage-independent growth (36 h) and re-plating on regular culture dishes. After 8 h, cells were gently washed (PBS) and photographed under a phase contrast microscope (scale bar, 20 μm). The images depict at least three independent experiments. (B) Schematic of 3D culture assay. (C) Quantification and size analysis of spheroids at days 5, 6, and 7. Unpaired t test, n = 3. Data are represented as mean ± SEM. *P < 0.05, **P < 0.01, and ***P < 0.001 denote significant differences. (D) Quantification of % live and dead cells in spheroids generated from SW480+Vector and SW480+MUC13 at day 7 after anchorage-independent stimulation. Unpaired t test, n = 3. Data are represented as mean ± SEM. *P < 0.05, **P < 0.01, and ***P < 0.001 denote significant differences. In all panels, the data are representative of at least three individual experiments, and data are represented as mean ± SEM. *P < 0.05, **P < 0.01, and ***P < 0.001 denote significant differences.

